问题是:条形图不使用索引值作为x轴,而是使用
range(0, n)。您可以使用
twiny()创建第二个与条形图共享y轴的轴,并在该第二轴中绘制线条曲线。
最困难的问题是如何对齐x轴刻度。在这里,我们定义了一个对齐函数,它将
ax2.get_xlim()[0]与
ax1中的
x1对齐,并将
ax2.get_xlim()[1]与
ax1中的
x2对齐:
def align_xaxis(ax2, ax1, x1, x2):
    "maps xlim of ax2 to x1 and x2 in ax1"
    (x1, _), (x2, _) = ax2.transData.inverted().transform(ax1.transData.transform([[x1, 0], [x2, 0]]))
    xs, xe = ax2.get_xlim()
    k, b = np.polyfit([x1, x2], [xs, xe], 1)
    ax2.set_xlim(xs*k+b, xe*k+b)
这是完整的代码:
from matplotlib import pyplot as plt
import pandas as pd
from pandas import Series
import numpy as np
n = 50
x = pd.period_range('2001-01-01', periods=n, freq='M')
y1 = (Series(np.random.randn(n)) + 5).tolist()
y2 = (Series(np.random.randn(n))).tolist()
df = pd.DataFrame({'bar':y2, 'line':y1}, index=x)
plt.figure(figsize=(20, 4))
ax1 = df['bar'].plot(kind='bar', label='bar')
ax2 = ax1.twiny()
df['line'].plot(kind='line', label='line', ax=ax2)
ax2.grid(color="red", axis="x")
def align_xaxis(ax2, ax1, x1, x2):
"maps xlim of ax2 to x1 and x2 in ax1"
(x1, _), (x2, _) = ax2.transData.inverted().transform(ax1.transData.transform([[x1, 0], [x2, 0]]))
xs, xe = ax2.get_xlim()
k, b = np.polyfit([x1, x2], [xs, xe], 1)
ax2.set_xlim(xs*k+b, xe*k+b)
align_xaxis(ax2, ax1, 0, n-1)
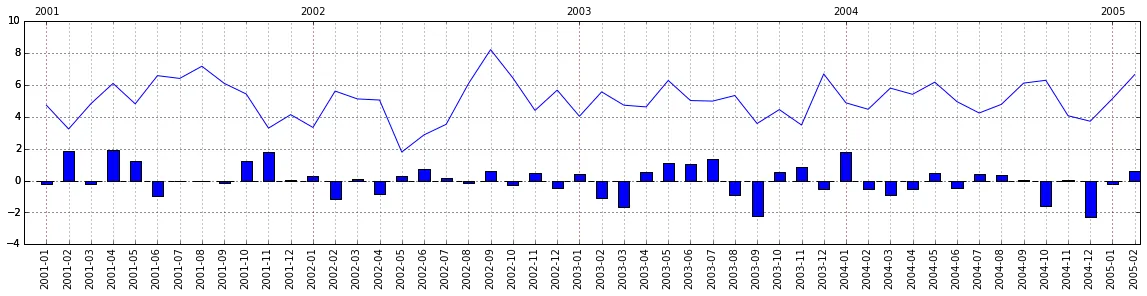
输出结果如下图所示: