我需要使用标准的Python包创建一个numpy 2D数组,表示多边形的二进制掩码。
- 输入: 多边形顶点, 图像尺寸
- 输出: 多边形的二进制掩码(numpy 2D数组)
(更大的背景:我想使用scipy.ndimage.morphology.distance_transform_edt获取此多边形的距离变换。)
有人能向我展示如何做到这一点吗?
我需要使用标准的Python包创建一个numpy 2D数组,表示多边形的二进制掩码。
(更大的背景:我想使用scipy.ndimage.morphology.distance_transform_edt获取此多边形的距离变换。)
有人能向我展示如何做到这一点吗?
import numpy
from PIL import Image, ImageDraw

# polygon = [(x1,y1),(x2,y2),...] or [x1,y1,x2,y2,...]
# width = ?
# height = ?

img = Image.new('L', (width, height), 0)
ImageDraw.Draw(img).polygon(polygon, outline=1, fill=1)
mask = numpy.array(img)
matplotlib.nxutils.points_inside_poly可以用于快速光栅化任意多边形。例如:import numpy as np
from matplotlib.nxutils import points_inside_poly
nx, ny = 10, 10
poly_verts = [(1,1), (5,1), (5,9),(3,2),(1,1)]
# Create vertex coordinates for each grid cell...
# (<0,0> is at the top left of the grid in this system)
x, y = np.meshgrid(np.arange(nx), np.arange(ny))
x, y = x.flatten(), y.flatten()
points = np.vstack((x,y)).T
grid = points_inside_poly(points, poly_verts)
grid = grid.reshape((ny,nx))
print grid
这将产生一个布尔型的numpy数组:
[[False False False False False False False False False False]
 [False  True  True  True  True False False False False False]
 [False False False  True  True False False False False False]
 [False False False False  True False False False False False]
 [False False False False  True False False False False False]
 [False False False False  True False False False False False]
 [False False False False False False False False False False]
 [False False False False False False False False False False]
 [False False False False False False False False False False]
 [False False False False False False False False False False]]
grid传递给任何scipy.ndimage.morphology函数。M = numpy.reshape(list(img.getdata()), (height, width)))。numpy.array(img)可以以更高效的方式完成完全相同的操作。 - Joe KingtonPIL 方法比 matplotlib 版本快约 70 倍!!! - jmetzmatplotlib.path提供的方法。import numpy as np
from matplotlib.path import Path
nx, ny = 10, 10
poly_verts = [(1,1), (5,1), (5,9),(3,2),(1,1)]
# Create vertex coordinates for each grid cell...
# (<0,0> is at the top left of the grid in this system)
x, y = np.meshgrid(np.arange(nx), np.arange(ny))
x, y = x.flatten(), y.flatten()
points = np.vstack((x,y)).T
path = Path(poly_verts)
grid = path.contains_points(points)
grid = grid.reshape((ny,nx))
print grid
contains_points中出现了内存错误。您能帮我找出问题吗? - Atihska作为对@Yusuke N.答案的轻微替代方案,请考虑使用matplotlib.path,它与from PIL import Image, ImageDraw的效率一样高(无需安装Pillow,无需考虑integer或float。有用吗?)
下面是可运行的代码:
import pylab as plt
import numpy as np
from matplotlib.path import Path
width, height=2000, 2000
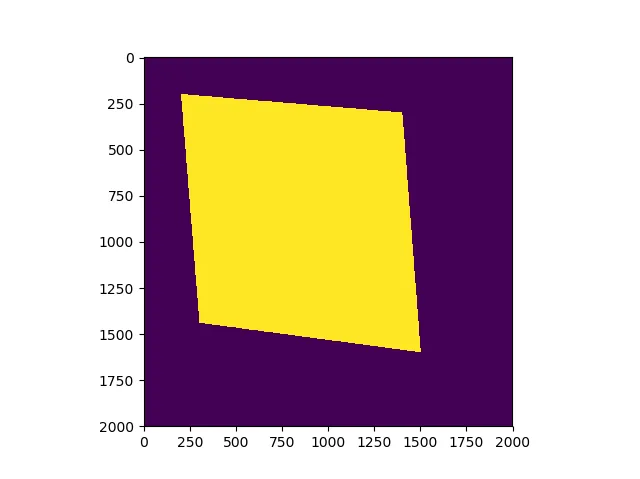
polygon=[(0.1*width, 0.1*height), (0.15*width, 0.7*height), (0.8*width, 0.75*height), (0.72*width, 0.15*height)]
poly_path=Path(polygon)
x, y = np.mgrid[:height, :width]
coors=np.hstack((x.reshape(-1, 1), y.reshape(-1,1))) # coors.shape is (4000000,2)
mask = poly_path.contains_points(coors)
plt.imshow(mask.reshape(height, width))
plt.show()
以下是结果图片,深色区域表示为False,亮色区域表示为True。
from PIL import Image, ImageDraw

img = Image.new('L', (width, height), 0)   # The Zero is to Specify Background Color
draw = ImageDraw.Draw(img)

for vertex in range(len(vertexlist)):
    startpoint = vertexlist[vertex]
    try: endpoint = vertexlist[vertex+1]
    except IndexError: endpoint = vertexlist[0]
    # The exception means We have reached the end and need to complete the polygon
    draw.line((startpoint[0], startpoint[1], endpoint[0], endpoint[1]), fill=1)

# If you want the result as a single list
# You can make a two dimensional list or dictionary by iterating over the height and width variable
list(img.getdata())

# If you want the result as an actual Image
img.save('polgon.jpg', 'JPEG')
poly_mask() 接受多个多边形作为输入,因此输出掩码可以由多个、最终不相连的多边形区域组成。value关键字,用于设置实际掩蔽值(例如,非常小/大的数字或NAN):为了实现这一点,掩码转换为浮点数组。def poly_mask(shape, *vertices, value=np.nan):
"""
Create a mask array filled with 1s inside the polygon and 0s outside.
The polygon is a list of vertices defined as a sequence of (column, line) number, where the start values (0, 0) are in the
upper left corner. Multiple polygon lists can be passed in input to have multiple,eventually not connected, ROIs.
column, line # x, y
vertices = [(x0, y0), (x1, y1), ..., (xn, yn), (x0, y0)] or [x0, y0, x1, y1, ..., xn, yn, x0, y0]
Note: the polygon can be open, that is it doesn't have to have x0,y0 as last element.
adapted from: https://dev59.com/N3A65IYBdhLWcg3wvxaE#64876117
:param shape: (tuple) shape of the output array (height, width)
:param vertices: (list of tuples of int): sequence of vertices defined as
[(x0, y0), (x1, y1), ..., (xn, yn), (x0, y0)] or
[x0, y0, x1, y1, ..., xn, yn, x0, y0]
Multiple lists (for multiple polygons) can be passed in input
:param value: (float or NAN) The masking value to use (e.g. a very small number). Default: np.nan
:return: (ndarray) the mask array
"""
width, height = shape[::-1]
# create a binary image
img = Image.new(mode='L', size=(width, height), color=0) # mode L = 8-bit pixels, black and white
draw = ImageDraw.Draw(img)
# draw polygons
for polygon in vertices:
draw.polygon(polygon, outline=1, fill=1)
# replace 0 with 'value'
mask = np.array(img).astype('float32')
mask[np.where(mask == 0)] = value
return mask
我更喜欢直接使用shape作为输入,而不是使用(width, height)。这样我可以像这样使用它:
polygon_lists = [
    [(x0, y0), (x1, y1), ..., (xn, yn), (x0, y0)],
    [# ... another sequence of coordinates...],
    [# ...yet another sequence of coordinates...],
                ]
my_mask = poly_mask(my_array.shape, *polygon_lists)
其中my_array是需要应用掩码的数组(或者是与之形状相同的另一个数组)。
my_array_masked = my_array * my_mask
import cv2
import numpy as np

# Create mask
image_width = 800
image_height = 600
mask = np.zeros((image_height, image_width), dtype=np.uint8)

# Define the vertices of a polygon
polygon_vertices = np.array([
    [(100, 100), (300, 100), (200, 300)],
    [(400, 200), (600, 200), (500, 400)]
], dtype=np.int32)

# Draw filled polygons
cv2.fillPoly(mask, polygon_vertices, color=(255))

# Display the image with the filled polygons
cv2.imshow('Filled Polygons', mask)
cv2.waitKey(0)
cv2.destroyAllWindows()

# Save the image with filled polygons to a file
cv2.imwrite('filled_polygons.png', mask)