这可能是一个愚蠢的问题,但在ggplot2手册和"阿姨"谷歌中我都找不到答案...
如果我有一个中心点和直径,我该如何使用ggplot2作为附加图层绘制一个圆形呢? 感谢您的帮助。
有一个更新更好的选择,它利用了一个名为ggforce的扩展包,该包定义了一个显式的geom_circle。
但是为了记录,这里提供了一个简单的圆函数:
circleFun <- function(center = c(0,0),diameter = 1, npoints = 100){
    r = diameter / 2
    tt <- seq(0,2*pi,length.out = npoints)
    xx <- center[1] + r * cos(tt)
    yy <- center[2] + r * sin(tt)
    return(data.frame(x = xx, y = yy))
}
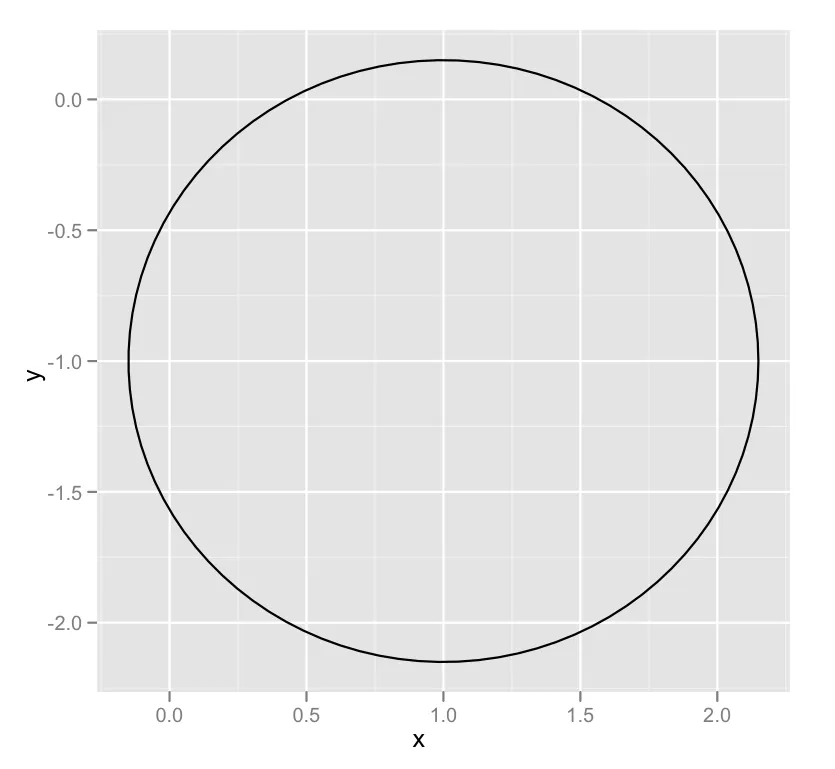
以下是它的使用演示:
dat <- circleFun(c(1,-1),2.3,npoints = 100)
#geom_path will do open circles, geom_polygon will do filled circles
ggplot(dat,aes(x,y)) + geom_path()
grid.circle,但要使其正常工作需要一些关于grid系统的知识。 - joran如果目的只是注释一个圆,您可以简单地使用几何形状 "path" 进行注释。无需创建数据框或函数:
如果只是为了注释一个圆,您可以使用 "path" 几何形状进行注释,而不需要创建数据帧或函数。
#g is your plot
#r, xc, yc are the radius and center coordinates

g<-g+annotate("path",
   x=xc+r*cos(seq(0,2*pi,length.out=100)),
   y=yc+r*sin(seq(0,2*pi,length.out=100)))
嗨,以下代码来自于ggplot2 Google组,可能会有所帮助:
dat = data.frame(x=runif(1), y=runif(1))
ggplot() + scale_x_continuous(limits = c(0,1)) +
scale_y_continuous(limits = c(0,1))+
geom_point(aes(x=x, y=y), data=dat, size=50, shape=1, color="gold4")
这将产生:
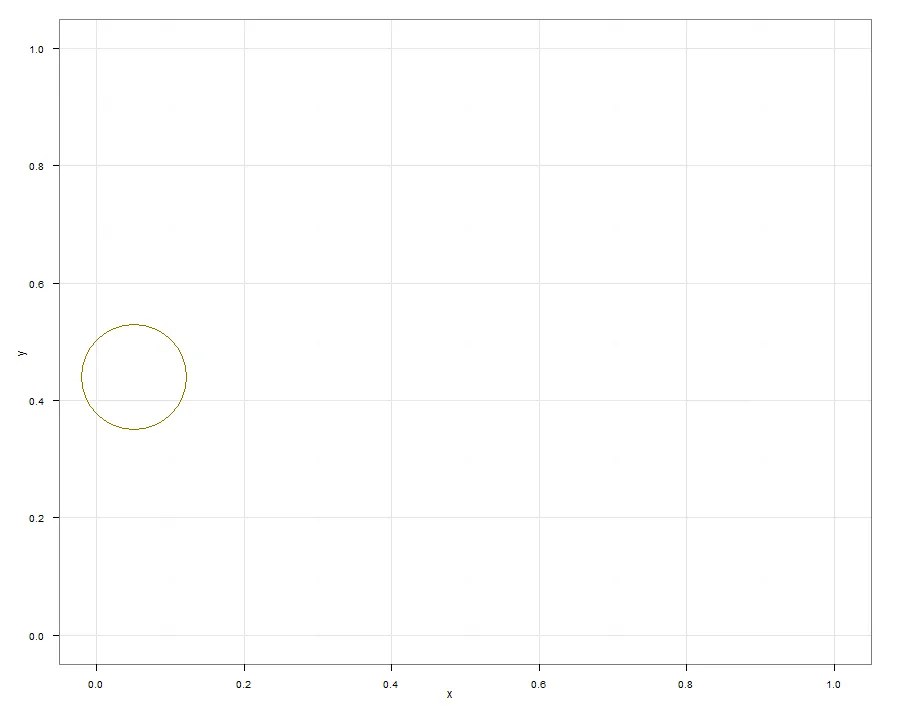
我希望这能帮助您开始为您的目的开发自定义示例。
使用ggplot2 >= 0.9,你还可以进行以下操作
library(grid)
qplot(1:10, 1:10, geom="blank") +
  annotation_custom(grob=circleGrob(r=unit(1,"npc")), xmin=2, xmax=4, ymin=4, ymax=6)
为了后人着想,在此提供一种更灵活的圆形解决方案,使用annotate和geom_ribbon支持填充、颜色、透明度和大小。
gg_circle <- function(r, xc, yc, color="black", fill=NA, ...) {
    x <- xc + r*cos(seq(0, pi, length.out=100))
    ymax <- yc + r*sin(seq(0, pi, length.out=100))
    ymin <- yc + r*sin(seq(0, -pi, length.out=100))
    annotate("ribbon", x=x, ymin=ymin, ymax=ymax, color=color, fill=fill, ...)
}
square <- ggplot(data.frame(x=0:1, y=0:1), aes(x=x, y=y))
square + gg_circle(r=0.25, xc=0.5, yc=0.5)
square + gg_circle(r=0.25, xc=0.5, yc=0.5, color="blue", fill="red", alpha=0.2)
还可以尝试这个方法,
ggplot() + geom_rect(aes(xmin=-1,ymin=-1,xmax=1,ymax=1), fill=NA) + coord_polar()