Matplotlib绘制热图的等角方向

3
假设我们有以下热图。

enter image description here

使用代码构建

import string
import numpy as np
from matplotlib import pyplot as plt
label=list(string.ascii_uppercase)
mdata = np.random.randn(3, len(label), len(label))
data = mdata[0, :, :]
data=np.tril(data,-1)
fig, ax = plt.subplots()
heatmap = ax.pcolor(data, cmap=plt.cm.Blues)
plt.show()

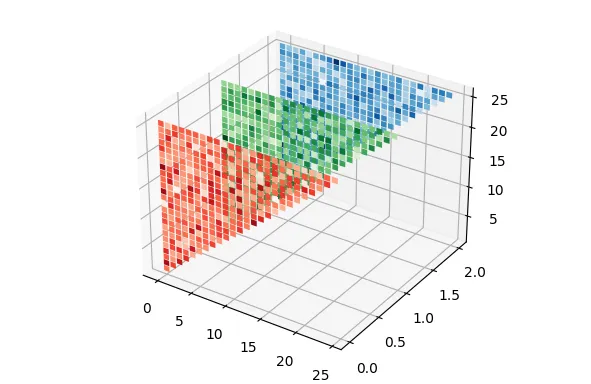
是否可以使用Matplotlib、Seaborn或其他软件包以如下等距对齐方式呈现。
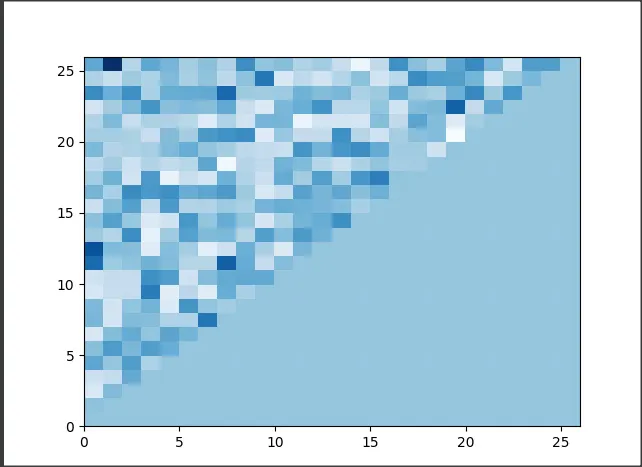
enter image description here

1个回答

3

使用matplotlib的3D工具包,并使用numpy的triu_indices,您可以从三角矩阵创建条形图:

import numpy as np
import matplotlib.pyplot as plt

ax = plt.figure().add_subplot(projection='3d')
N = 26
data = np.random.randn(3, N, N)
for i, (plane, cmap) in enumerate(zip(data, ['Reds', 'Greens', 'Blues'])):
    indices = np.triu_indices(N, 1)
    norm = plt.Normalize(plane.min(), plane.max())
    ax.bar(left=indices[0], bottom=indices[1], height=0.9,
           zs=i, zdir='y',
           color=plt.get_cmap(cmap)(norm(plane[indices])))
plt.show()

drawing heatmap in 3D planes

PS:为了拥有完整的矩形,需要将np.indices生成的子数组变成一维数组:

import numpy as np
import matplotlib.pyplot as plt

ax = plt.figure().add_subplot(projection='3d')
N = 26
data = np.random.randn(3, N, N)
for i, (plane, cmap) in enumerate(zip(data, ['Reds', 'Greens', 'Blues'])):
    indices = np.indices((N,N))
    norm = plt.Normalize(plane.min(), plane.max())
    ax.bar(left=indices[0].ravel(), bottom=indices[1].ravel(), height=0.9,
           zs=i, zdir='y',
           color=plt.get_cmap(cmap)(norm(plane).ravel()))
plt.show()

3D planes of heatmaps


太棒了。为了未来读者和我自己的利益(有点贪心),您介意分享绘制完整数组的代码片段吗?(包括 OP 图中显示的上三角和下三角) - mpx
嗨@JohanC,我将
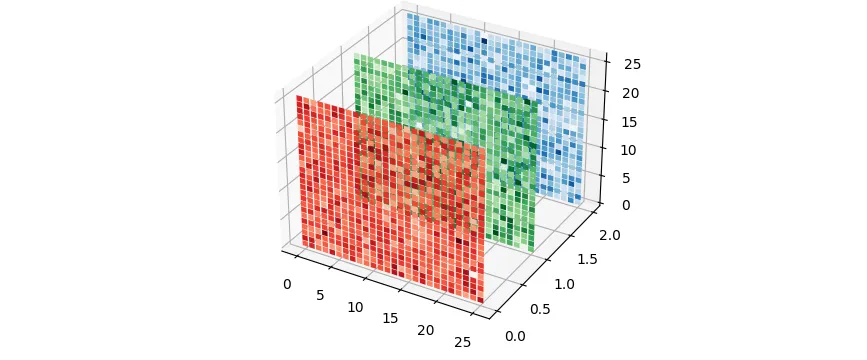
triu_indices更改为np.indices((N, N)),但是没有成功。请给予建议。 - mpx

网页内容由stack overflow 提供, 点击上面的
可以查看英文原文,
原文链接