绘制热图的上/下三角形部分
29
- Boris Gorelik
2
2也许他们只是用Photoshop修改了它 :) - endolith
1请以另一种方式回答:链接 - teddcp
6个回答
32
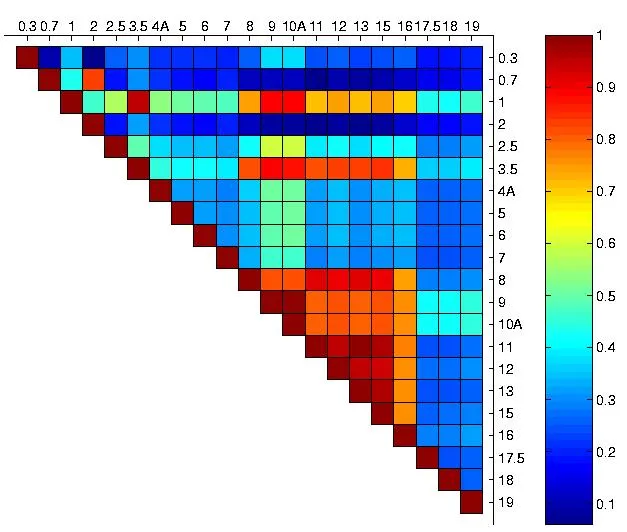
问题在于doug提供的答案依赖于colormap将零值映射为白色的事实。这意味着不包括白色颜色的colormap是无用的。解决方案的关键是
cm.set_bad函数。您可以使用None或NumPy掩码数组屏蔽矩阵的不需要部分,并将set_bad设置为白色,而不是默认的黑色。采用doug的示例,我们得到以下结果:import numpy as NP
from matplotlib import pyplot as PLT
from matplotlib import cm as CM
A = NP.random.randint(10, 100, 100).reshape(10, 10)
mask = NP.tri(A.shape[0], k=-1)
A = NP.ma.array(A, mask=mask) # mask out the lower triangle
fig = PLT.figure()
ax1 = fig.add_subplot(111)
cmap = CM.get_cmap('jet', 10) # jet doesn't have white color
cmap.set_bad('w') # default value is 'k'
ax1.imshow(A, interpolation="nearest", cmap=cmap)
ax1.grid(True)
PLT.show()
- Boris Gorelik
5
不错!这个方法也适用于
pcolormesh,这正是我需要的解决方案。另外请注意,在代码行mask=NP.tri(A.shape[0],k=0)中,将k=-1更改为k=0以排除对角线。 - Vlox@Vlox,您好。我在想,如何屏蔽掉上三角形? - chitown88
1@chitown88 在绘图前应该能够直接转换矩阵,所以只需在行
A = NP.ma.array(A, mask=mask).T 后添加 .T 即可。 - Vlox@Vlox,啊好的。我做了一点不同,但你的更有意义。 - chitown88
这非常有用 - 谢谢。对于那些想要使用“新的”颜色映射(如“plasma”,“rocket”,“magma”,“inferno”,“viridis”)的人来说,我有一个小建议,你可以跳过
cmap.set_bad()这一步,因为它们已经将其设置为白色。你可以通过打印cmap.get_bad()来验证。你应该会得到array([0., 0., 0., 0.])。 - LeviAckerman13
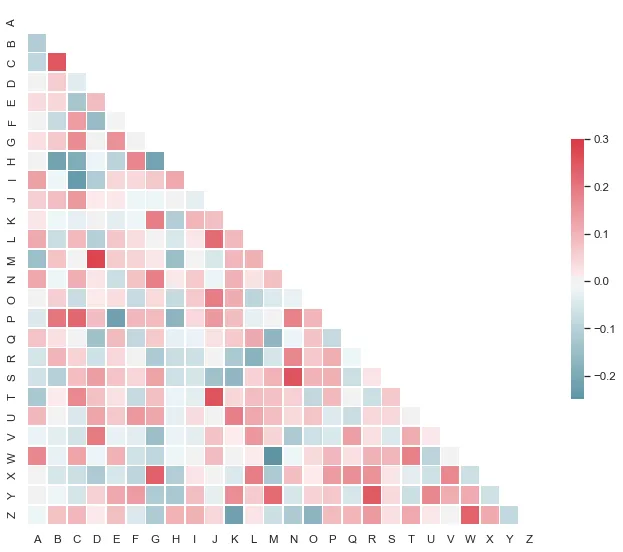
我得到的最佳答案来自seaborn。输出是一个光滑且外观简单的图形。这个函数将三角形保存到本地。
def get_lower_tri_heatmap(df, output="cooc_matrix.png"):
    mask = np.zeros_like(df, dtype=np.bool)
    mask[np.triu_indices_from(mask)] = True

    # Want diagonal elements as well
    mask[np.diag_indices_from(mask)] = False

    # Set up the matplotlib figure
    f, ax = plt.subplots(figsize=(11, 9))

    # Generate a custom diverging colormap
    cmap = sns.diverging_palette(220, 10, as_cmap=True)

    # Draw the heatmap with the mask and correct aspect ratio
    sns_plot = sns.heatmap(data, mask=mask, cmap=cmap, vmax=.3, center=0,
            square=True, linewidths=.5, cbar_kws={"shrink": .5})
    # save to file
    fig = sns_plot.get_figure()
    fig.savefig(output)
- Itachi
11
import numpy as NP
from matplotlib import pyplot as PLT
from matplotlib import cm as CM
A = NP.random.randint(10, 100, 100).reshape(10, 10)
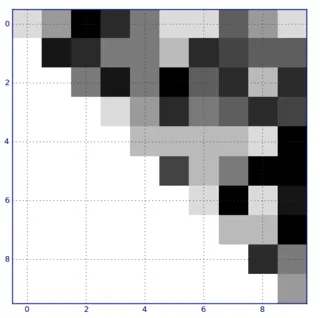
# create an upper triangular 'matrix' from A
A2 = NP.triu(A)
fig = PLT.figure()
ax1 = fig.add_subplot(111)
# use dir(matplotlib.cm) to get a list of the installed colormaps
# the "_r" means "reversed" and accounts for why zero values are plotted as white
cmap = CM.get_cmap('gray_r', 10)
ax1.imshow(A2, interpolation="nearest", cmap=cmap)
ax1.grid(True)
PLT.show()
- doug
1
2感谢您包含您的导入。可运行的示例非常有帮助。 - jcdyer
2
您可以在一个白色矩阵上绘制,其上/下部分是透明的。
a =random((10,10))
imshow(a, interpolation='nearest')

b = ones(a.shape+(4,)) # «white» matrix with alpha=1
for i in range(a.shape[0]):
    for j in range(i, a.shape[1]):
        b[i,j,3] = 0   # upper triangle, alpha = 0
imshow(b, interpolation='nearest')
热图的上/下三角区域 http://lh5.ggpht.com/_ZgVr3-a-Z00/S4P3_BWByKI/AAAAAAAAAXE/UsJpokz6LKE/pp.png
- remosu
2
使用
请参考
seaborn、matplotlib 和 numpy,快速解决方案如下:import matplotlib.pyplot as plt
import seaborn as sns
# Say your matrix object (e.g. np.array) is corr_mat
# Get the upper triangle without the diagonal
corr_mat = np.triu(corr_mat, k=1)
# Plot the heatmap
ax = sns.heatmap(corr_mat)
请参考
seaborn 的在线文档进行美化。- tagoma
2
1这段代码是可以运行的,但是有一个潜在的问题:它会去掉列名,并因此无法使用
xticklabels=corr.columns.values选项。解决方法是首先声明名称(例如xnames=corr.columns.values),然后使用np.triu(),最后将xticklabels=xnames作为参数发送。 - Mitchell van Zuylen1@tagoma 这实际上显示了对角线以下的零。我该如何删除这些单元格,而不是显示零? - Khurram Majeed
1
you can use this code:
from string import ascii_letters
import numpy as np
import pandas as pd
import seaborn as sns
import matplotlib.pyplot as plt

sns.set_theme(style="white")

# Generate a large random dataset
rs = np.random.RandomState(33)
d = pd.DataFrame(data=rs.normal(size=(100, 26)),
                 columns=list(ascii_letters[26:]))

# Compute the correlation matrix
corr = d.corr()

# Generate a mask for the upper triangle
mask = np.triu(np.ones_like(corr, dtype=bool))

# Set up the matplotlib figure
f, ax = plt.subplots(figsize=(11, 9))

# Generate a custom diverging colormap
cmap = sns.diverging_palette(230, 20, as_cmap=True)

# Draw the heatmap with the mask and correct aspect ratio
sns.heatmap(corr, mask=mask, cmap=cmap, vmax=.3, center=0,
            square=True, linewidths=.5, cbar_kws={"shrink": .5})
- Tiradan Raad
2
网页内容由stack overflow 提供, 点击上面的可以查看英文原文,
原文链接
原文链接