重绘Seaborn图表以制作动画效果

11
一些像JointPlot这样的seaborn方法在每次调用时创建新的图形。这使得像在matplotlib中那样通过迭代调用plt.cla()或plt.clf()来更新图形内容而无需每次关闭/打开窗口的简单动画变得不可能。
我目前唯一能看到的解决方案是:
for t in range(iterations):
    # .. update your data ..

    if 'jp' in locals():
        plt.close(jp.fig)

    jp = sns.jointplot(x=data[0], y=data[1])
    plt.pause(0.01)

这样做的原因是在创建新窗口之前关闭了上一个窗口。但是,当然,这还远非理想。
有更好的方法吗?图是否可以直接在先前生成的Figure对象上完成?或者有没有办法防止这些方法在每次调用时生成新的图形?
2个回答

23

sns.jointplot创建一个独立的图形。为了使联合绘图动画化,因此可以重用此已创建的图形,而不是在每次迭代中重新创建一个新图形。

jointplot内部创建了一个JointGrid,因此直接使用它并逐个绘制联合轴和边际轴是有意义的。在每次动画的步骤中,然后更新数据,清除轴并设置它们,就像创建网格时一样。不幸的是,这最后一步涉及很多代码行。

最终的代码可能如下所示:

import matplotlib.pyplot as plt
import matplotlib.animation
import seaborn as sns
import numpy as np

def get_data(i=0):
    x,y = np.random.normal(loc=i,scale=3,size=(2, 260))
    return x,y

x,y = get_data()
g = sns.JointGrid(x=x, y=y, size=4)
lim = (-10,10)

def prep_axes(g, xlim, ylim):
    g.ax_joint.clear()
    g.ax_joint.set_xlim(xlim)
    g.ax_joint.set_ylim(ylim)
    g.ax_marg_x.clear()
    g.ax_marg_x.set_xlim(xlim)
    g.ax_marg_y.clear()
    g.ax_marg_y.set_ylim(ylim)
    plt.setp(g.ax_marg_x.get_xticklabels(), visible=False)
    plt.setp(g.ax_marg_y.get_yticklabels(), visible=False)
    plt.setp(g.ax_marg_x.yaxis.get_majorticklines(), visible=False)
    plt.setp(g.ax_marg_x.yaxis.get_minorticklines(), visible=False)
    plt.setp(g.ax_marg_y.xaxis.get_majorticklines(), visible=False)
    plt.setp(g.ax_marg_y.xaxis.get_minorticklines(), visible=False)
    plt.setp(g.ax_marg_x.get_yticklabels(), visible=False)
    plt.setp(g.ax_marg_y.get_xticklabels(), visible=False)


def animate(i):
    g.x, g.y = get_data(i)
    prep_axes(g, lim, lim)
    g.plot_joint(sns.kdeplot, cmap="Purples_d")
    g.plot_marginals(sns.kdeplot, color="m", shade=True)

frames=np.sin(np.linspace(0,2*np.pi,17))*5
ani = matplotlib.animation.FuncAnimation(g.fig, animate, frames=frames, repeat=True)

plt.show()
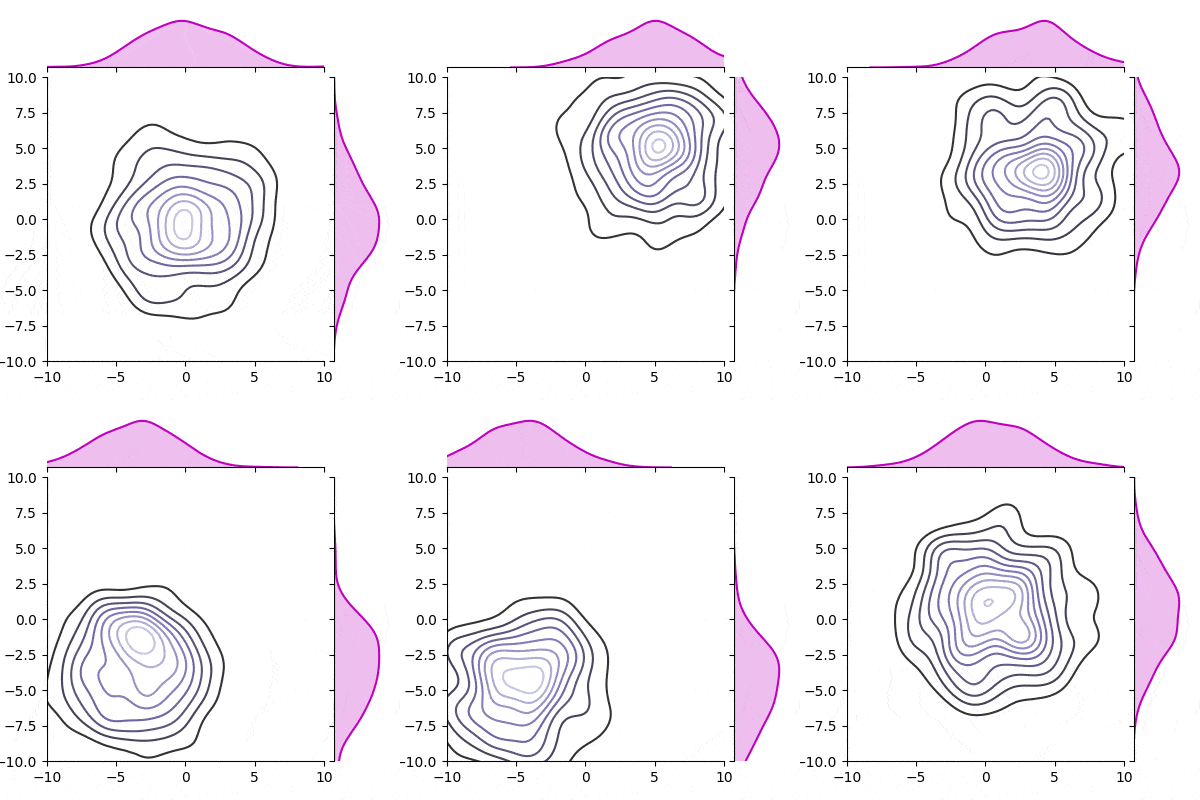
输入图片描述


我一直怀疑会出现这种情况。希望能更直接简单些,但这样做很好地完成了工作,非常感谢。 - runDOSrun
从seaborn的源代码中可以看出,它显然没有考虑绘制动画图时的可能性。当然,根据最终目标,可以进行一些优化。我考虑子类化JointGrid以使其更容易更新,将其放入新模块中并在需要时调用——但只有在需要经常执行此类动画时才有意义。还要记住,seaborn主要是将matplotlib包装起来,因此解决方案可能是仅使用matplotlib复制jointplot所做的事情。 - ImportanceOfBeingErnest
请问您能否说明一下如何在lmplot中重新绘制图形,因为我无法重新绘制。 - Parthiban Rajendran
@PaariVendhan 这个问题涉及到 JointGrid,但实际上对于其他 seaborn 的 *Grid 来说概念是相同的。您需要单独更新网格的轴。 - ImportanceOfBeingErnest

5
使用 celluloid 包(https://github.com/jwkvam/celluloid),我能够轻松地为 seaborn 绘图添加动画效果。
import numpy as np
from celluloid import Camera
import pandas as pd
import seaborn as sns
import matplotlib.pyplot as plt

fig = plt.figure()
camera = Camera(fig)

# animation draws one data point at a time
for i in range(0, data.shape[0]):
    plot = sns.scatterplot(x=data.x[:i], y=data.y[:i])
    camera.snap()

anim = camera.animate(blit=False)
anim.save('animation.mp4')

我相信类似的代码也可以为联合数据绘图编写。

事实证明,与他们的示例相反,保存功能在Celluloid中不起作用,因为它使用Pillow进行保存,而Pillow不支持视频格式。这段代码对我来说失败了。 - user2188329
我认为你需要安装ffmpeg。 - Adam B
嗨,亚当。我发现指定一个写入器是有效的。例如:anim.save('/home/blws1/Desktop/animated_gif.gif', writer='imagemagick')。在我的情况下,动画gif效果很好。我尝试使用ffmpeg作为指定的写入器,但无法将其用于mp4。 - user2188329
你确定 FFmpeg 安装正确了吗?在 Mac 上,我不得不使用 Homebrew 安装 FFmpeg,然后上面的代码就可以正常工作了。 - Adam B
请注意,每次创建新图形的 seaborn 图形级接口将无法使用。例如,histplot 的解决方法是预先制作轴,然后将相同的轴传递给 seaborn 函数。 - Max

网页内容由stack overflow 提供, 点击上面的
可以查看英文原文,
原文链接