使用Mayavi绘制3D网络时删除节点

3
我用Networkx创建了一个图形网络,并使用Mayavi绘制出来。
在创建图形后,我使用
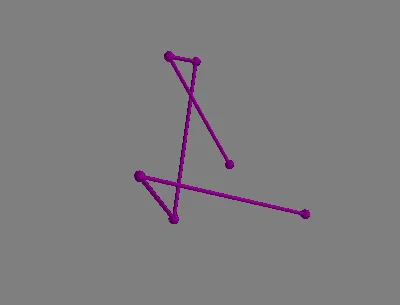
G.remove_nodes_from()删除度数小于2的节点。一旦节点被删除,与这些节点相连的边也会被删除,但是这些节点仍然出现在最终输出中(如下图所示)。
import matplotlib.pyplot as plt
from mayavi import mlab
import numpy as np
import pandas as pd
    
    
pos = [[0.1, 2, 0.3], [40, 0.5, -10],
       [0.1, -40, 0.3], [-49, 0.1, 2],
       [10.3, 0.3, 0.4], [-109, 0.3, 0.4]]
pos = pd.DataFrame(pos, columns=['x', 'y', 'z'])
    
ed_ls = [(x, y) for x, y in zip(range(0, 5), range(1, 6))]
    
G = nx.Graph()
G.add_edges_from(ed_ls)
remove = [node for node, degree in dict(G.degree()).items() if degree < 2]
G.remove_nodes_from(remove)
pos.drop(pos.index[remove], inplace=True)

print(G.edges)
    
nx.draw(G)
plt.show()
    
mlab.figure(1, bgcolor=bgcolor)
mlab.clf()
    
for i, e in enumerate(G.edges()):
    
# ----------------------------------------------------------------------------
    # the x,y, and z co-ordinates are here
    pts = mlab.points3d(pos['x'], pos['y'], pos['z'],
                        scale_mode='none',
                        scale_factor=1)
# ----------------------------------------------------------------------------
    pts.mlab_source.dataset.lines = np.array(G.edges())
    tube = mlab.pipeline.tube(pts, tube_radius=edge_size)
    
    mlab.pipeline.surface(tube, color=edge_color)
    
mlab.show()  # interactive window

enter image description here

我想请教如何删除已删除节点及其相应位置,并在输出中显示其余部分的建议。
其次,我想知道如何交互式地删除与这些节点相连的节点和边缘。例如,如果我想删除度数小于2的节点和与其相连的边缘,首先我想显示一个交互式图形,其中所有度数小于2的节点都突出显示。用户可以以交互方式选择要删除的节点。通过单击突出显示的节点,可以删除节点和连接边缘。
编辑:我尝试从上面发布的完整代码中包含pos.drop(pos.index [remove],inplace = True)来删除已删除节点的位置。
但是我仍然无法获得正确的输出。

enter image description here


1
关于1):在你的代码中,节点是否被绘制似乎完全取决于pos,因此你将不得不从字典中删除这些节点。 - Paul Brodersen
@PaulBrodersen 谢谢。是的,我可以在“remove”中删除节点的位置并重新绘制图形。 - Natasha
@PaulBrodersen,你能看一下我的编辑吗? - Natasha
1个回答

2
这里提供了Mayavi中交互式删除网络节点和边的解决方案(我认为Matplotlib可能足够且更简单,但无论如何...)。
该解决方案受到this Mayavi example的启发。然而,该示例不是直接可转移的,因为一个glyph(用于可视化节点)由许多点组成,当单独绘制每个glyph/node时,point_id不能用于标识glyph/node。此外,它也不包括隐藏/删除对象的选项。为了避免这些问题,我使用了四个想法:
每个节点/边缘都被绘制为一个单独的对象,因此更容易调整其(可见性)属性。不删除节点/边缘,而是在单击时隐藏它们。此外,双击使节点再次可见(对于下面的代码中的边缘不起作用,但如果需要,您可能能够实现它,只需要跟踪可见节点)。可见节点可以在最后收集(请参见下面的代码)。与示例一样,使用拾取器回调捕获鼠标位置。但是,不使用最接近点的point_id,而是直接使用其坐标。通过计算鼠标位置和所有节点之间的最小欧几里得距离来找到要删除/隐藏的节点。PS:在您的原始代码中,for循环非常冗余,因为它将所有节点和边缘多次绘制在彼此之上。希望这有所帮助!

enter image description here

# import modules
from mayavi import mlab
import numpy as np
import pandas as pd
import networkx as nx

# set number of nodes
number = 6

# create random node positions
np.random.seed(5)
pos = 100*np.random.rand(6, 3)
pos = pd.DataFrame(pos, columns=['x', 'y', 'z'])

# create chain graph links
links = [(x, y) for x, y in zip(range(0, number-1), range(1, number))]

# create graph (not strictly needed, link list above would be enough)
graph = nx.Graph()
graph.add_edges_from(links)

# setup mayavi figure
figure = mlab.gcf()
mlab.clf()

# add nodes as individual glyphs
# store glyphs in dictionary to allow interactive adjustments of visibility
color = (0.5, 0.0, 0.5)
nodes = dict()
texts = dict()
for ni, n in enumerate(graph.nodes()):
    xyz = pos.loc[n]
    n = mlab.points3d(xyz['x'], xyz['y'], xyz['z'], scale_factor=5, color=color)
    label = 'node %s' % ni
    t = mlab.text3d(xyz['x'], xyz['y'], xyz['z']+5, label, scale=(5, 5, 5))
    # each glyph consists of many points
    # arr = n.glyph.glyph_source.glyph_source.output.points.to_array()
    nodes[ni] = n
    texts[ni] = t

# add edges as individual tubes
edges = dict()
for ei, e in enumerate(graph.edges()):
    xyz = pos.loc[np.array(e)]
    edges[ei] = mlab.plot3d(xyz['x'], xyz['y'], xyz['z'], tube_radius=1, color=color)


# define picker callback for figure interaction
def picker_callback(picker):
    # get coordinates of mouse click position
    cen = picker.pick_position
    # compute Euclidean distance btween mouse position and all nodes
    dist = np.linalg.norm(pos-cen, axis=1)
    # get closest node
    ni = np.argmin(dist)
    # hide/show node and text
    n = nodes[ni]
    n.visible = not n.visible
    t = texts[ni]
    t.visible = not t.visible
    # hide/show edges
    # must be adjusted if double-clicking should hide/show both nodes and edges in a reasonable way
    for ei, edge in enumerate(graph.edges()):
        if ni in edge:
            e = edges[ei]
            e.visible = not e.visible


# add picker callback
picker = figure.on_mouse_pick(picker_callback)
picker.tolerance = 0.01

# show interactive window
# mlab.show()

# collect visibility/deletion status of nodes, e.g.
# [(0, True), (1, False), (2, True), (3, True), (4, True), (5, True)]
[(key, node.visible) for key, node in nodes.items()]

其实,我不确定matplotlib是否具有绘制3D图形网络的功能。非常感谢您的回答。我想知道在3D图中是否可以添加节点编号作为节点标签。如果使用欧几里得距离时可能会出现“最小欧几里得距离”失败的情况吗?我们是否可以找到位于“鼠标单击位置”相邻的节点,并使用它来隐藏边缘,而不是使用欧几里得距离? - Natasha
1
(1)基本的matplotlib节点和边缘绘图在3D中没有问题(例如https://matplotlib.org/mpl_toolkits/mplot3d/tutorial.html)。 我刚刚看到获取3D坐标很麻烦(https://matplotlib.org/users/event_handling.html,https://stackoverflow.com/a/50283567/5350621),抱歉,但是它可以完成。 (2)关于节点标签,我使用mlab.text3d扩展了示例。 (3)最小欧几里得距离始终返回最近的节点,因此它执行您最后一个问题似乎要求的操作,不能“失败”。但是3D点击不是“唯一”的,因此请尽可能避免。 - David

网页内容由stack overflow 提供, 点击上面的
可以查看英文原文,
原文链接