我使用了
mlab_3D_to_2D.py 示例 和 PGFPlots 手册中的“支持外部三维图形”一节来为 Mayavi 制作了一个概念验证方案 -> PGFPlots。
操作步骤:
- 使用修改过的
mlab_3D_to_2D.py 在 Mayavi 中生成 img.png。在控制台上会输出四个随机点,将其复制到剪贴板上。请注意,脚本中硬编码了图像大小和分辨率,这些应该根据不同的图像大小进行编辑或自动提取。
- 将这些点粘贴到
mlab_pgf.tex 中。
- 对
mlab_pgf.tex 运行 LaTeX。
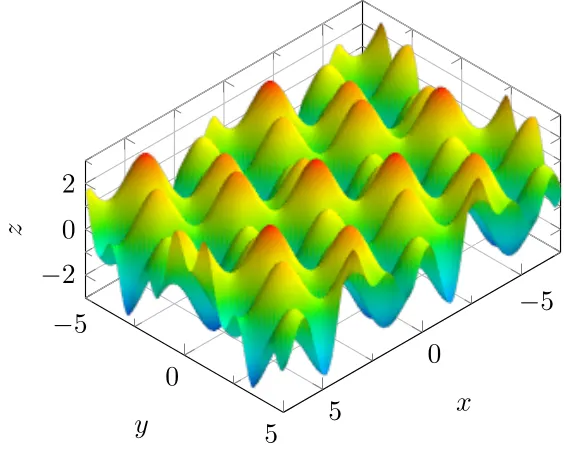
结果如下所示:
修改过的
mlab_3D_to_2D.py:
from __future__ import print_function
import matplotlib
import pylab as pl
import numpy as np
from mayavi import mlab
from mayavi.core.ui.mayavi_scene import MayaviScene
def get_world_to_view_matrix(mlab_scene):
"""returns the 4x4 matrix that is a concatenation of the modelview transform and
perspective transform. Takes as input an mlab scene object."""
if not isinstance(mlab_scene, MayaviScene):
raise TypeError('argument must be an instance of MayaviScene')
scene_size = tuple(mlab_scene.get_size())
clip_range = mlab_scene.camera.clipping_range
aspect_ratio = float(scene_size[0])/float(scene_size[1])
vtk_comb_trans_mat = mlab_scene.camera.get_composite_projection_transform_matrix(
aspect_ratio, clip_range[0], clip_range[1])
np_comb_trans_mat = vtk_comb_trans_mat.to_array()
return np_comb_trans_mat
def get_view_to_display_matrix(mlab_scene):
""" this function returns a 4x4 matrix that will convert normalized
view coordinates to display coordinates. It's assumed that the view should
take up the entire window and that the origin of the window is in the
upper left corner"""
if not (isinstance(mlab_scene, MayaviScene)):
raise TypeError('argument must be an instance of MayaviScene')
x, y = tuple(mlab_scene.get_size())
view_to_disp_mat = np.array([[x/2.0, 0., 0., x/2.0],
[ 0., -y/2.0, 0., y/2.0],
[ 0., 0., 1., 0.],
[ 0., 0., 0., 1.]])
return view_to_disp_mat
def apply_transform_to_points(points, trans_mat):
"""a function that applies a 4x4 transformation matrix to an of
homogeneous points. The array of points should have shape Nx4"""
if not trans_mat.shape == (4, 4):
raise ValueError('transform matrix must be 4x4')
if not points.shape[1] == 4:
raise ValueError('point array must have shape Nx4')
return np.dot(trans_mat, points.T).T
def test_surf():
"""Test surf on regularly spaced co-ordinates like MayaVi."""
def f(x, y):
sin, cos = np.sin, np.cos
return sin(x + y) + sin(2 * x - y) + cos(3 * x + 4 * y)
x, y = np.mgrid[-7.:7.05:0.1, -5.:5.05:0.05]
z = f(x, y)
s = mlab.surf(x, y, z)
return x, y, z, s
if __name__ == '__main__':
f = mlab.figure()
f.scene.parallel_projection = True
N = 4
x, y, z, s = test_surf()
mlab.move(forward=2.0)
W = np.ones(x.flatten().shape)
hmgns_world_coords = np.column_stack((x.flatten(), y.flatten(), z.flatten(), W))
comb_trans_mat = get_world_to_view_matrix(f.scene)
view_coords = \
apply_transform_to_points(hmgns_world_coords, comb_trans_mat)
norm_view_coords = view_coords / (view_coords[:, 3].reshape(-1, 1))
view_to_disp_mat = get_view_to_display_matrix(f.scene)
disp_coords = apply_transform_to_points(norm_view_coords, view_to_disp_mat)
img = mlab.screenshot(figure=f, mode='rgba', antialiased=True)
pl.imsave("img.png", img)
pl.imshow(img)
idx = np.random.choice(range(disp_coords[:, 0:2].shape[0]), N, replace=False)
for i in idx:
a = hmgns_world_coords[:, 0:3][i]
a = str(list(a)).replace('[', '(').replace(']', ')').replace(' ',',')
b = np.array([0, 298]) - disp_coords[:, 0:2][i]
b = b * np.array([-1, 1])
b[0] = b[0] / 400 * 288
b[1] = b[1] / 298 * 214.6
b = str(list(b)).replace('[', '(').replace(']', ')').replace(' ',',')
print(a, "=>", b)
pl.plot([disp_coords[:, 0][i]], [disp_coords[:, 1][i]], 'ro')
pl.show()
mlab.show()
mlab_pgf.py:
\documentclass{standalone}
\usepackage{pgfplots}
\pgfplotsset{compat=1.17}
\begin{document}
\begin{tikzpicture}
\begin{axis}[
grid=both,minor tick num=1,
xlabel=$x$,ylabel=$y$,zlabel=$z$,
xmin=-7,
xmax=7,
ymin=-5,
ymax=5,
zmin=-3,
zmax=3,
]
\addplot3 graphics [
points={
(5.100000000000001, -3.8, 2.9491697063900895) => (69.82857610254948, 129.60245304203693)
(-6.2, -3.0999999999999996, 0.6658335107904079) => (169.834990346303, 158.6375879061911)
(-1.7999999999999998, 0.4500000000000002, -1.0839565197346115) => (162.75120267070378, 103.53696636434113)
(-5.3, -4.9, 0.6627774166307937) => (147.33354714145847, 162.93938533017257)
},
] {img.png};
\end{axis}
\end{tikzpicture}
\end{document}