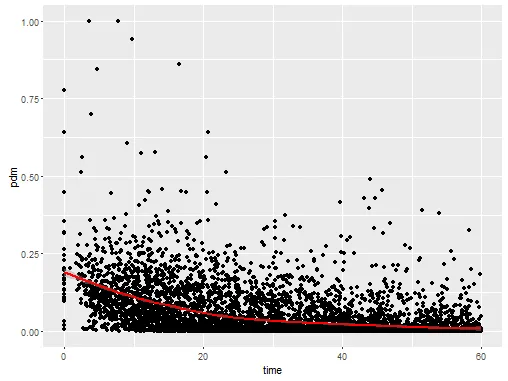
我有一个数据集,我使用 ggplot2 的 stat_smooth 绘制了回归曲线:
ggplot(data = mydf, aes(x=time, y=pdm)) + geom_point() + stat_smooth(col="red")
ggplot(data = mydf, aes(x=time, y=pdm, z=surface)) + geom_point() + stat_smooth(col="red") + stat_quantile(quantiles = c(0.25,0.75))
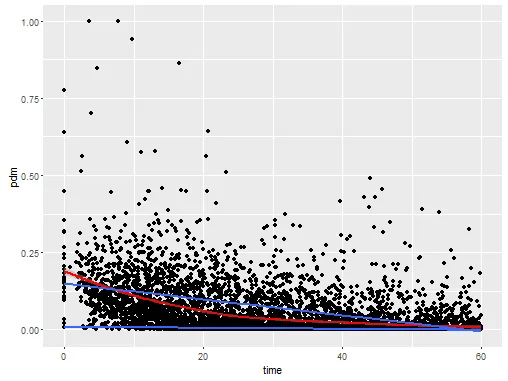
stat_quantile()中放置method="loess",如果我没有弄错的话,这将解决我的问题。(如果不清楚,期望的行为=分位数的非线性回归,因此Q25和Q75的回归曲线在我的红色曲线下方和上方(分别),如果绘制Q50,则是我的红色曲线)。
谢谢。
formula参数中放置来自stats的loess()是不是可能的? - François M.loess,代码如下:stat_quantile(formula = loess(mydf$pdm ~ mydf$time), quantiles = c(0.25, 0.5, 0.75)),但是出现了以下错误提示:Warning messages:1: 'newdata' had 100 rows but variables found have 6816 rows2: Computation failed in 'stat_quantile()':replacement has 6816 rows, data has 100,我不知道它想告诉我什么。 - François M.stat_quantile中使用loess。stat_quantile使用quantreg包中的rq函数。rq处理具有多项式和样条的公式(如我的答案),但不执行loess回归(据我所知)。 关于语法的说明:如果loess函数可以执行分位数回归,则调用将类似于此:stat_quantile(method =“loess”,quantiles = c(0.25,0.75))(这也隐含地使用formula = y〜x)。 - eipi10stat_smooth():ggplot(data = qdfm, aes(x=time, y=pdm)) + geom_point() + geom_smooth(col="red") + stat_smooth(data = qdfm, aes(x = time, y = Q25)) + stat_smooth(data = qdfm, aes(x = time, y = Q75))。 - François M.