matplotlib中的彩色线框图绘制

22
我想要根据 z 值给线框图上色。但是我在网上找不到任何代码示例。
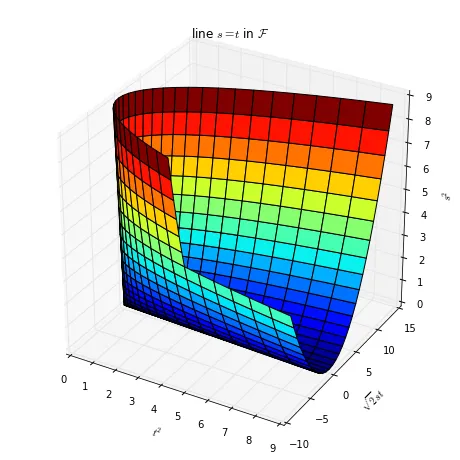
这里有一个表面图的示例,它有我想要的颜色,还有一个线框图,我无法在线上获得颜色:
import numpy as np
from mpl_toolkits.mplot3d import Axes3D
from matplotlib import cm
import matplotlib.pyplot as plt

# some numbers for the data
P=12000 #W
Q=1     #kg/s
DT=3    #K
cp=4169.32  #J/kgK

dDT=np.logspace(-2,0,20,endpoint=True)
dQ=Q*np.logspace(-3,-1,20,endpoint=True)

# the plotting data
m1,m2=np.meshgrid(dDT,dQ)
err=cp*np.sqrt((m1*Q)**2+(m2*DT)**2)/P

# the wiremesh plot that i need fixed
fig=plt.figure()
ax = fig.add_subplot(111, projection='3d')
ax.plot_wireframe(m1, m2, err, color=err/err.max(),cmap='jet')
ax.set_xlabel('dDT')
ax.set_ylabel('DQ')
ax.set_zlabel('relative error')

# the surface plot that has the colors i want
fig = plt.figure()
ax = fig.gca(projection='3d')

surf = ax.plot_surface(m1, m2, err,rstride=1,  cstride=1, cmap=cm.jet,
    linewidth=0.1, antialiased=False)

fig.colorbar(surf, shrink=0.5, aspect=5)

ax.set_xlabel('dDT')
ax.set_ylabel('DQ')
ax.set_zlabel('relative error')
plt.show()

非常感谢您的帮助!


可能是 https://dev59.com/yoHba4cB1Zd3GeqPV8o0#24958192 的重复问题? - GBy
3个回答

29

当您使用plot_wireframe时,每条线只能有一种颜色。相反,您可以使用plot_surface。为了让plot_surface设置edgecolors,您需要给它facecolors。然后,您可以将facecolors的alpha设置为零。

from mpl_toolkits.mplot3d import axes3d
import matplotlib.pyplot as plt
from matplotlib import cm

X, Y, Z = axes3d.get_test_data(0.2)

# Normalize to [0,1]
norm = plt.Normalize(Z.min(), Z.max())
colors = cm.viridis(norm(Z))
rcount, ccount, _ = colors.shape

fig = plt.figure()
ax = fig.gca(projection='3d')
surf = ax.plot_surface(X, Y, Z, rcount=rcount, ccount=ccount,
                       facecolors=colors, shade=False)
surf.set_facecolor((0,0,0,0))
plt.show()

彩色线框图


谢谢。效果很好,但速度相当慢,大约与使用光源相同。遗憾的是必须将 Z 正规化才能使其正常工作,但我想通过调整颜色映射处理可以避免这种情况。 - Paulus
@Paulus 我修改了代码,只对颜色进行了归一化处理。 - slek120
这段代码没有呈现线框图,但你发布了线框图。 - Grzegorz Krug
@GrzegorzKrug 你修改了代码吗?我使用相同的代码得到了相同的图形。 - slek120
@slek120,我错过了上一个命令,抱歉给您带来不便 :) 它已经可以工作了。 - Grzegorz Krug

4

我曾经遇到过一个类似的问题,就是根据变量对圆圈进行着色和调整大小,但是这也没有起作用。因此,我的解决方法是对变量的值进行分段,并循环处理每个段。我掩盖了数据,使得数组mask只包含该段中具有值的数据。

ax.plot_wireframe(mask[i], ..., color="red")
ax.plot_wireframe(mask[i], ..., color="blue") 
etc.

我知道这并不是很优美的写法,但在我的情况下它确实胜任了任务 ;)

3
也许你需要使用plot_surface代替?
import matplotlib.pylab as plt
from matplotlib import cm 
from mpl_toolkits.mplot3d import Axes3D

fig = plt.figure(figsize=(8, 8))
ax = fig.gca(projection='3d')

t = np.linspace(-3, 2, 31)
s = np.linspace(-3, 2, 31)

T, S = np.meshgrid(t, s)

ax.plot_surface(T * T, sqrt2 * T * S, S * S, cmap=cm.jet, rstride=1, cstride=1)

ax.set_xlabel('$t^2$')
ax.set_ylabel('$\sqrt{2} s t$')
ax.set_zlabel('$s^2$')

ax.set_title('line $s = t$ in $\cal F$')

plt.show()

enter image description here


网页内容由stack overflow 提供, 点击上面的
可以查看英文原文,
原文链接