假设变量
d1存储的是双精度表示(介于0和1之间的值)的
灰度强度图像,最后5行将把该灰度图像转换为一个
3D RGB图像 iout,它看起来与原始灰度图像相同,只是轮廓以青色叠加在图像上。
以下是一个示例,使用MATLAB
图像处理工具箱中包含的图像
'cameraman.tif':
d1 = double(imread('cameraman.tif'))./255;
subplot(2, 2, 1); imshow(d1); title('d1');
d = edge(d1, 'canny', .6);
subplot(2, 2, 2); imshow(d); title('d');
ds = bwareaopen(d, 40);
subplot(2, 2, 3); imshow(ds); title('ds');
iout = d1;
BW = ds;
iout(:, :, 1) = iout;
iout(:, :, 2) = iout(:, :, 1);
iout(:, :, 3) = iout(:, :, 1);
iout(:, :, 2) = min(iout(:, :, 2) + BW, 1.0);
iout(:, :, 3) = min(iout(:, :, 3) + BW, 1.0);
subplot(2, 2, 4); imshow(iout); title('iout');
这是上面代码创建的图形:
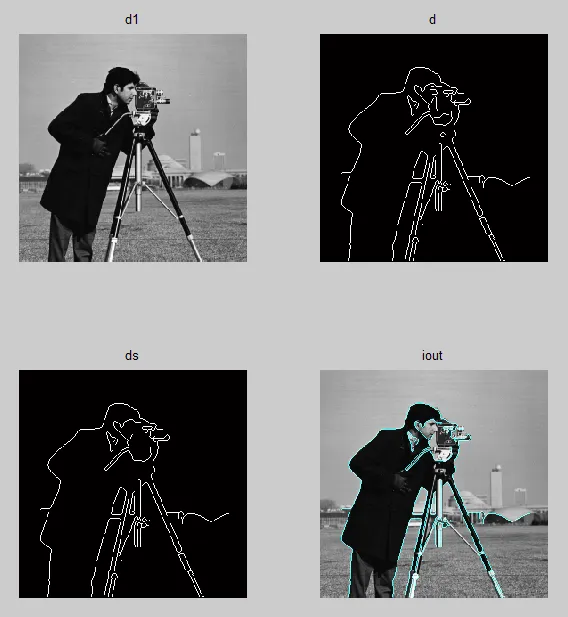
它是如何工作的...
图像iout的创建与边缘检测算法无关。它只是一种简单的方法,用于显示之前步骤中找到的边缘。2-D灰度强度图像无法显示颜色,因此,如果要向图像添加彩色轮廓线,必须首先将其转换为可以显示颜色的格式:索引图像(在我的经验中稍微难以处理)或3-D RGB图像(第三个维度表示每个像素的红色、绿色和蓝色颜色分量)。
在第三个维度中将灰度图像复制3次,我们得到一个3-D RGB图像,最初仍然包含灰色颜色(每个像素的红、绿、蓝颜色成分相等)。但是,通过修改每个颜色平面的某些像素,我们可以为图像添加颜色。通过将逻辑边缘掩码BW(边缘出现的地方为1,其他地方为0)添加到绿色和蓝色颜色平面上,那些发现轮廓的像素将呈现青色。函数min的调用确保添加图像的结果永远不会导致像素颜色值超过值1.0,这是双精度3-D RGB图像的最大值。
还应该注意到,创建3-D RGB图像的代码可以简化为以下内容:
iout = d1;
iout(:, :, 2) = min(d1+ds, 1.0);
iout(:, :, 3) = min(d1+ds, 1.0);