我想知道是否有一种方法可以显示我的x轴应该有多长。我有一条记录,其中包含不同的异常值。我可以使用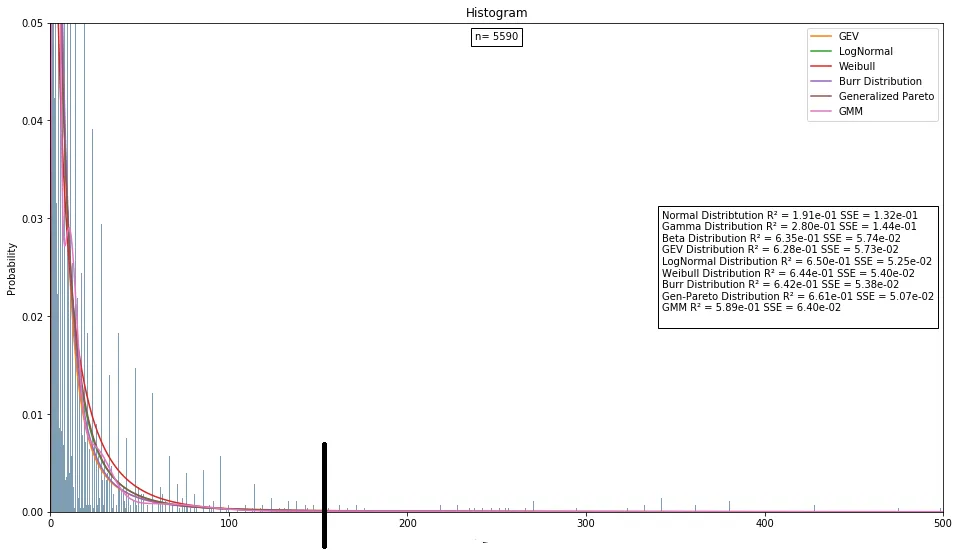 该定义获取的数据框是标准的pandas数据框。
代码:
plt.xlim()来剪切它们,但是否有统计方法来计算有意义的x轴限制?在添加的图片中,一个逻辑分割点是在行驶距离150公里后。计算分割点的阈值将是完美的。
该定义获取的数据框是标准的pandas数据框。代码:
def yearly_distribution(dataframe):


    df_distr = dataframe

    h=sorted(df_distr['Distance'])
    l=len(h)

    fig, ax =plt.subplots(figsize=(16,9))

    binwidth = np.arange(0,501,0.5)

    n, bins, patches = plt.hist(h, bins=binwidth, normed=1, facecolor='#023d6b', alpha=0.5, histtype='bar')

    lnspc =np.arange(0,500.5,0.5)

    gevfit = gev.fit(h)
    pdf_gev = gev.pdf(lnspc, *gevfit)
    plt.plot(lnspc, pdf_gev, label="GEV")

    logfit = stats.lognorm.fit(h)
    pdf_lognorm = stats.lognorm.pdf(lnspc, *logfit)
    plt.plot(lnspc, pdf_lognorm, label="LogNormal")

    weibfit = stats.weibull_min.fit(h)
    pdf_weib = stats.weibull_min.pdf(lnspc, *weibfit)
    plt.plot(lnspc, pdf_weib, label="Weibull")

    burrfit = stats.burr.fit(h)
    pdf_burr = stats.burr.pdf(lnspc, *burrfit)
    plt.plot(lnspc, pdf_burr, label="Burr Distribution")

    genparetofit = stats.genpareto.fit(h)
    pdf_genpareto = stats.genpareto.pdf(lnspc, *genparetofit)
    plt.plot(lnspc, pdf_genpareto, label ="Generalized Pareto")

    myarray = np.array(h)

    clf = GMM(8,n_iter=500, random_state=3)
    myarray.shape = (myarray.shape[0],1)
    clf = clf.fit(myarray)
    lnspc.shape = (lnspc.shape[0],1)
    pdf_gmm = np.exp(clf.score(lnspc))
    plt.plot(lnspc, pdf_gmm, label = "GMM")

    plt.xlim(0,500)
    plt.xlabel('Distance')
    plt.ylabel('Probability')
    plt.title('Histogram')
    plt.ylim(0,0.05)