目前我正在2x2子图中绘制3个图。它看起来像这样:
fig, axes = plt.subplots(nrows=2, ncols=2)
df1.plot('type_of_plot', ax=axes[0, 0]);
df2.plot('type_of_plot', ax=axes[0, 1]);
df3.plot('type_of_plot', ax=axes[1, 0]);
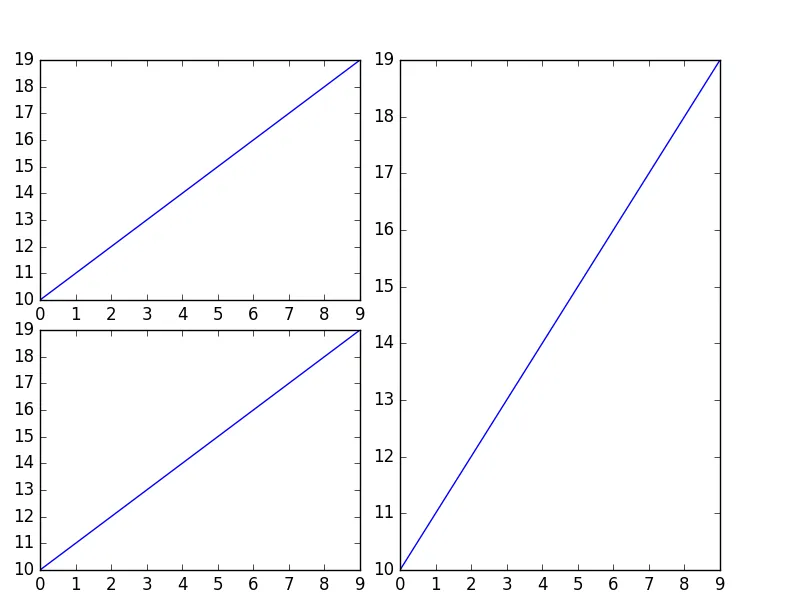
第四个图子区是空的,我想让第三个占据最后一行的整个空间。我尝试了不同的第三个子区域的轴组合,例如axes [1]、axes [1:]和axes [1,:]。但所有的结果都会导致错误。那么我该如何实现我的需求呢?