如何绘制一个带有所有x轴刻度的pandas多级索引数据框

18

我有一个像这样的 pandas 数据框:

                     content
date                        
2013-12-18 12:30:00        1
2013-12-19 10:50:00        1
2013-12-24 11:00:00        0
2014-01-02 11:30:00        1
2014-01-03 11:50:00        0
2013-12-17 16:40:00       10
2013-12-18 10:00:00        0
2013-12-11 10:00:00        0
2013-12-18 11:45:00        0
2013-12-11 14:40:00        4
2010-05-25 13:05:00        0
2013-11-18 14:10:00        0
2013-11-27 11:50:00        3
2013-11-13 10:40:00        0
2013-11-20 10:40:00        1
2008-11-04 14:49:00        1
2013-11-18 10:05:00        0
2013-08-27 11:00:00        0
2013-09-18 16:00:00        0
2013-09-27 11:40:00        0

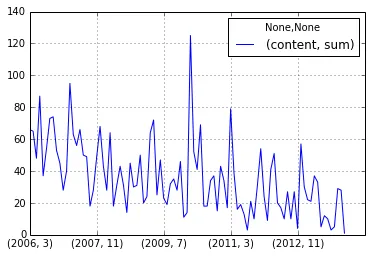
将日期作为索引,我使用以下方法将值缩减到月份:

dataFrame = dataFrame.groupby([lambda x: x.year, lambda x: x.month]).agg([sum])

输出结果为:

         content
             sum
2006 3        66
     4        65
     5        48
     6        87
     7        37
     8        54
     9        73
     10       74
     11       53
     12       45
2007 1        28
     2        40
     3        95
     4        63
     5        56
     6        66
     7        50
     8        49
     9        18
     10       28

现在当我绘制这个数据框时,我希望x轴将每个月/年显示为刻度。我尝试过设置xticks但似乎不起作用。如何实现这一目标?这是使用dataFrame.plot()绘制的当前图:

enter image description here

1个回答

32
你可以使用 set_xtick()set_xticklabels()
idx = pd.date_range("2013-01-01", periods=1000)
val = np.random.rand(1000)
serie = pd.Series(val, idx)
df = serie.groupby([serie.index.year, serie.index.month]).mean()

ax = df.plot()
ax.set_xticks(range(len(df)))
ax.set_xticklabels(["%s-%02d" % item for item in df.index.tolist()], rotation=90)

输出:

enter image description here


如何将xticks设置为每个月的第一天? - HyperCube
请查看我的答案:https://dev59.com/DlkS5IYBdhLWcg3wiXXI#48401584 - Cord Kaldemeyer

网页内容由stack overflow 提供, 点击上面的
可以查看英文原文,
原文链接