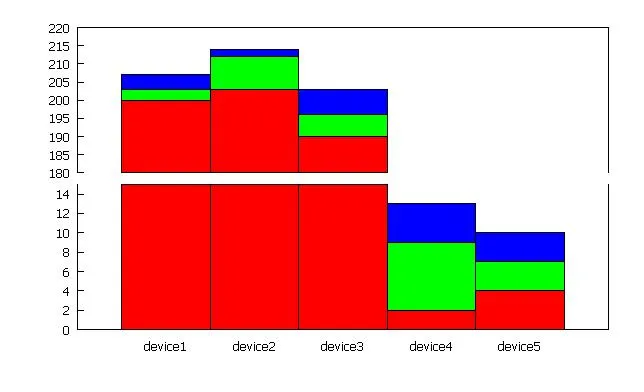
我有一个包含一些小值和一些非常大值的直方图。我该如何将 y 轴分成两部分?
编辑:
gnuplot 示例:
set style histogram columnstacked
set style data histograms
set key autotitle columnheader
plot for [i=2:6] 'test.dat' using i
test.dat:
action device1 device2 device3
load    200 203 190 2 4
process 3 9 6 7 3
save    4 2 7 4 3
yticks。 - mishik