我有一个像这样的gnuplot脚本:
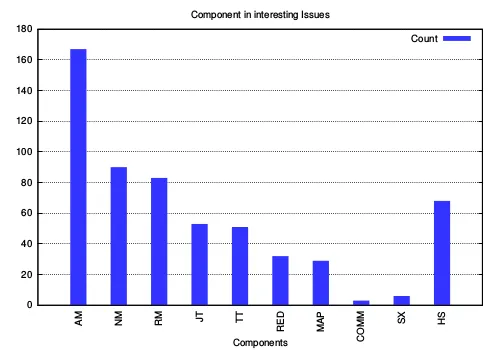
这是我的输出: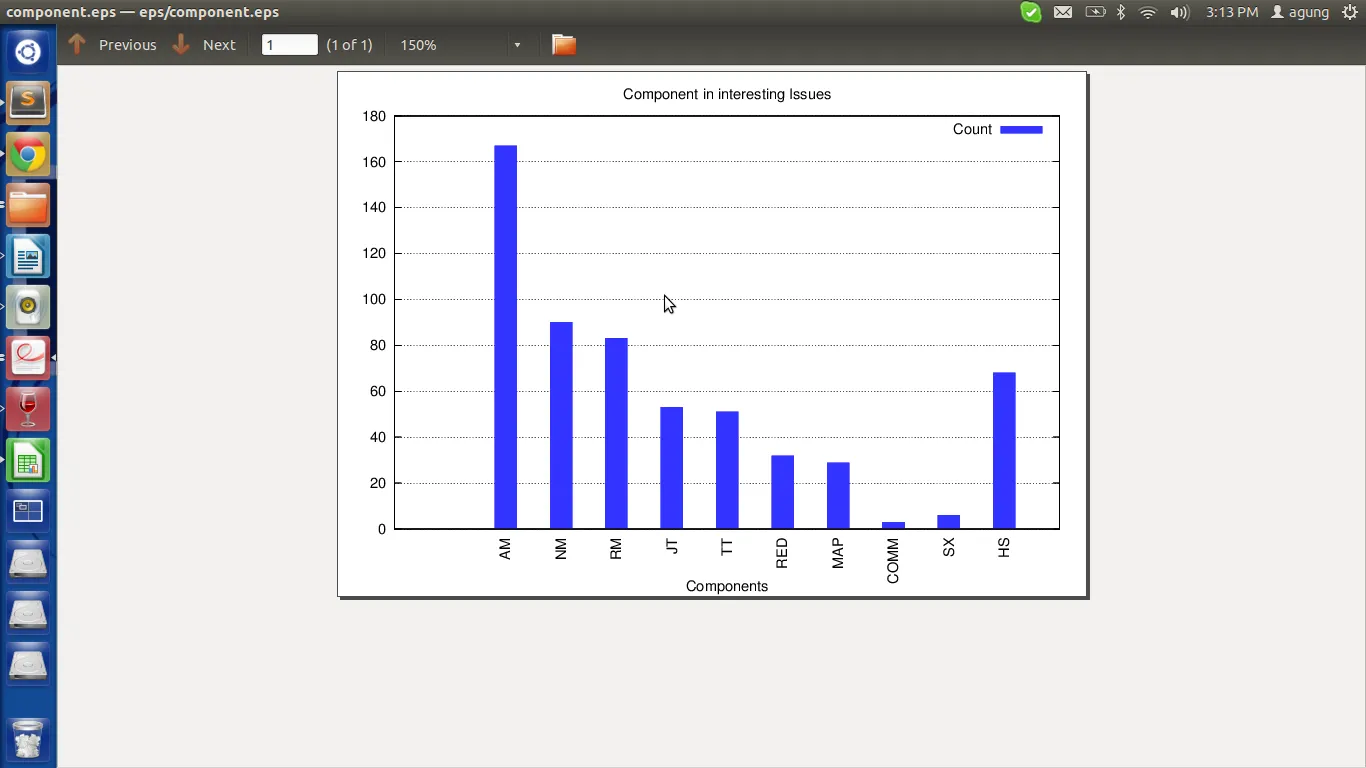 我发现我的图表中,Y轴和第一根柱状条之间有很长的空间。如何使柱状条均匀地分开?
set term pos eps
set style data histogram
set style histogram clustered gap 1
set grid y
set boxwidth 0.8 absolute
set style fill transparent solid 0.8 noborder
#set key outside right top vertical Left

#component stuff
set output 'eps/component.eps'
set title "Component in interesting Issues"
set xlabel "Components"
set xtics nomirror rotate by -270
plot 'dat/!component' using 2:xtic(1) t "Count" lc rgbcolor "blue" lt 1
和数据:
Cmp count
AM    167
NM    90
RM    83
JT    53
TT    51
RED   32
MAP   29
COMM  3
SX    6
HS    68
这是我的输出:
我发现我的图表中,Y轴和第一根柱状条之间有很长的空间。如何使柱状条均匀地分开?