我正在尝试为以下数据绘制直方图:
<text>,<percentage>
--------------------
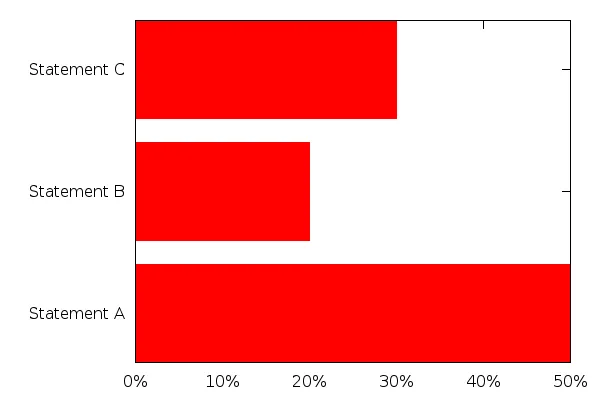
"Statement A",50%
"Statement B",20%
"Statement C",30%
我使用set datafile separator ","来获取相应的列。图应该在X轴上有百分比,在Y轴上有语句(完整的字符字符串)。因此,每个直方图都是水平的。
如何在gnuplot中实现这一点?或者是否有其他绘制好矢量图像的工具可用?