我有以下几点内容:
0.00049 1.509
0.00098 1.510
0.00195 1.511
0.00293 1.509
0.00391 1.510
0.00586 1.523
0.00781 1.512
0.01172 1.514
0.01562 1.510
0.02344 1.511
0.03125 1.510
0.04688 7.053
0.06250 7.054
0.09375 7.187
0.125 7.184
0.1875 7.177
0.25 7.207
0.375 16.588
0.5 24.930
0.75 39.394
1 56.615
1.5 77.308
2 84.909
3 89.056
4 88.485
6 88.678
8 89.022
12 88.513
16 88.369
24 88.512
32 88.536
48 87.792
64 87.716
96 87.589
128 87.608
192 87.457
256 87.388
以下是gnuplot脚本:
#! /usr/bin/gnuplot
set terminal png
set output "lat_mem_rd.png"
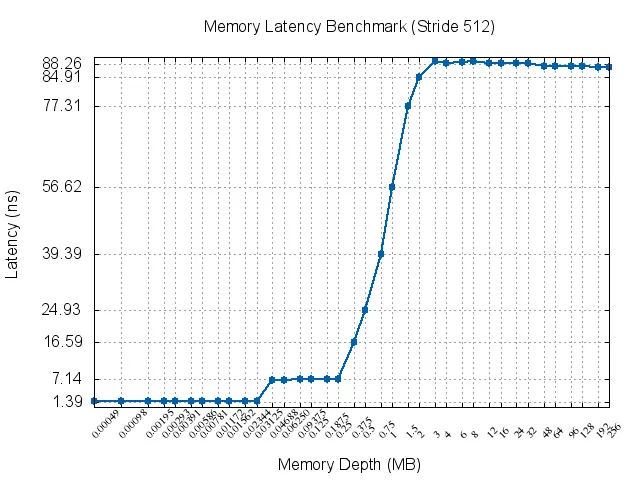
set title "Memory Latency Benchmark (Stride 512)"
set xlabel "Memory Depth (MB)"
set ylabel "Latency (ns)"
set xtics rotate by 45 offset 0,-1
set xtics font "Times-Roman, 8"
set grid
set style line 1 lc rgb '#0060ad' lt 1 lw 2 pt 7 ps 1 # --- blue
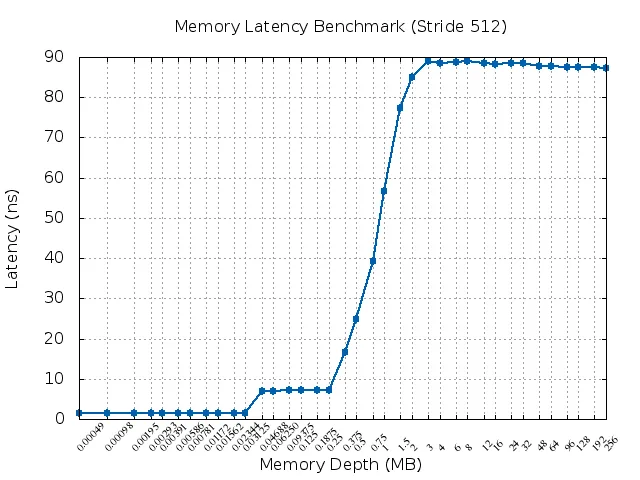
plot "lat_mem_rd.dat" using (log($1)):2:xtic(1) smooth unique title "" with linespoints ls 1
这会生成以下图形:
但我想在y轴标签中显示一个近似值,例如,对于所有x值介于3和256之间的值,y标签设置为一个值,比如88.513,它对应于x=12或其他值(或者如果不太困难,则为这些点的平均值)...
对于x值介于0和0.02344之间以及x值介于0.03125和0.1875之间的值也是同样的处理方式。
这些y值将替换值10、20、...、90。