我有一个包含折线的二进制图像,它是这样创建的:
cv2.polylines(binaryImage,contours,1, (255,255,255))
我现在需要一种有效的方法来填充所有多段线。我在opencv中没有找到这样的方法,但也许存在。或者,也许我可以实现算法来完成任务(但要快速-我有高清准备好的图片)。请分享您的想法...
使用 cv2.drawContours() 函数并设置 thickness=cv2.FILLED:
cv2.drawContours(img, contours, -1, color=(255, 255, 255), thickness=cv2.FILLED)
我认为你需要的是cv2.fillPoly函数,它可以填充一个或多个多边形所围成的区域。这是一个简单的代码片段,我生成了一个由四个点表示正方形顶点的轮廓,然后用白色填充了多边形。
import numpy as np
import cv2

contours = np.array( [ [50,50], [50,150], [150, 150], [150,50] ] )
img = np.zeros( (200,200) ) # create a single channel 200x200 pixel black image
cv2.fillPoly(img, pts =[contours], color=(255,255,255))
cv2.imshow(" ", img)
cv2.waitKey()

如果您的轮廓是封闭的,可以使用fillPoly或drawContours。综合@jabaldonedo和@ash-ketchum的答案:
import cv2
import matplotlib.pyplot as plt
import numpy as np

# Lets first create a contour to use in example
cir = np.zeros((255,255))
cv2.circle(cir,(128,128),10,1)
res = cv2.findContours(cir.astype(np.uint8), cv2.RETR_EXTERNAL, cv2.CHAIN_APPROX_NONE)
contours = res[-2] # for cv2 v3 and v4+ compatibility

# An open circle; the points are in contours[0]
plt.figure()
plt.imshow(cir)

# Option 1: Using fillPoly
img_pl = np.zeros((255,255))
cv2.fillPoly(img_pl,pts=contours,color=(255,255,255))
plt.figure()
plt.imshow(img_pl)

# Option 2: Using drawContours
img_c = np.zeros((255,255))
cv2.drawContours(img_c, contours, contourIdx=-1, color=(255,255,255),thickness=-1)
plt.figure()
plt.imshow(img_c)

plt.show()
img_pl和img_c都包含轮廓[0]中的点所填充的圆。
此代码在python 3.6.2,OpenCV(cv2.version)3.2.0,numpy 1.13.1和matplotlib 2.0.2中测试。我怀疑它也适用于任何cv2 3+和python 3.5+。根据@elyas-karimi (以及OpenCV文档)的说法,在3.x版本中findContours返回3个值,在4.x版本中则返回2个(不包括图像返回,自3.2版以来未修改)。
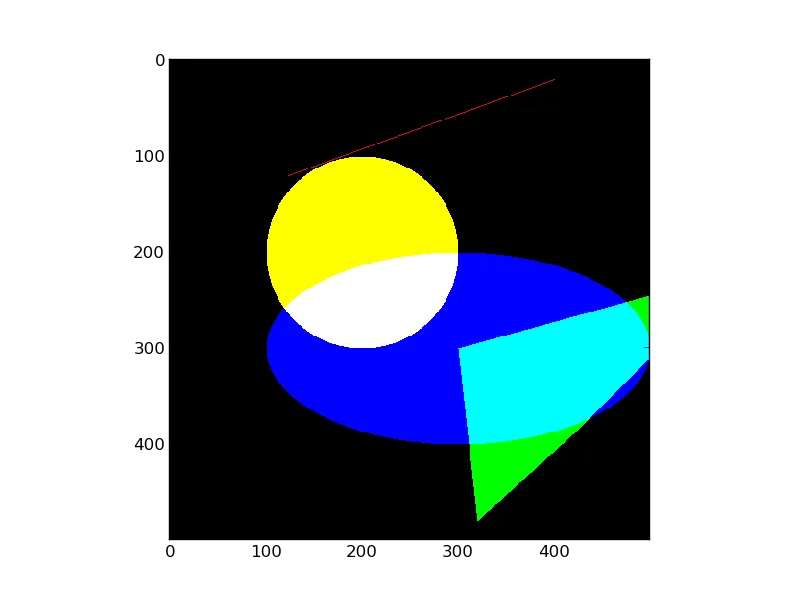
ValueError: not enough values to unpack (expected 3, got 2)。 - Omar Shababcv2.findContours()只返回两个参数,而不是三个。你只需要像这样使用该方法:contours, _ = cv2.findContours(cir.astype(np.uint8), cv2.RETR_EXTERNAL, cv2.CHAIN_APPROX_NONE)(只需删除第一个“_”符号)。这里是OpenCV文档(OpenCV 4.3.0):https://docs.opencv.org/4.3.0/d4/d73/tutorial_py_contours_begin.html - Elyas Karimi我知道OP是在询问使用OpenCV,但我最终来到这里只是想尝试填充分割多边形,尽管(同时,OpenCV对我的情况有点棘手)库和我相信许多其他用户也是如此,所以这是我的解决方案,使用scikit image的polygonfunction。
从文档中得知:
import matplotlib.pyplot as plt

from skimage.draw import line, polygon, circle, ellipse
import numpy as np


img = np.zeros((500, 500, 3), 'uint8')

# draw line
rr, cc = line(120, 123, 20, 400)
img[rr,cc,0] = 255

# fill polygon
poly = np.array((
    (300, 300),
    (480, 320),
    (380, 430),
    (220, 590),
    (300, 300),
))
rr, cc = polygon(poly[:,0], poly[:,1], img.shape)
img[rr,cc,1] = 255

# fill circle
rr, cc = circle(200, 200, 100, img.shape)
img[rr,cc,:] = (255, 255, 0)

# fill ellipse
rr, cc = ellipse(300, 300, 100, 200, img.shape)
img[rr,cc,2] = 255

plt.imshow(img)
plt.show()
thickness=-1- Cabarathickness=cv2.FILLED,因为那样更清晰易懂。 :) - Mateen Ulhaq