我想要将位图文件中不同颜色的数量可视化。
我的数据表看起来像这样:
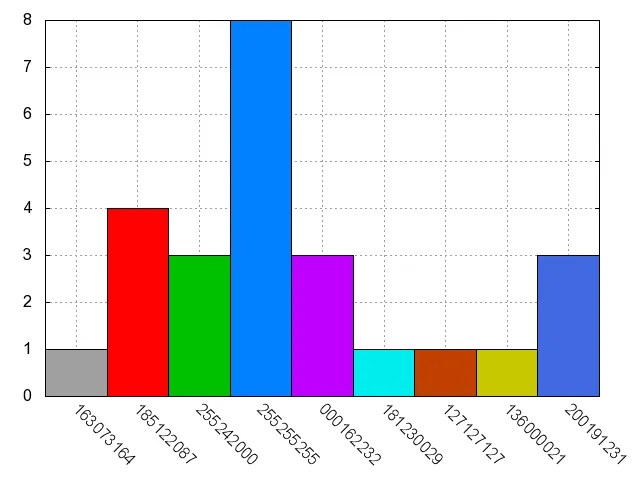
1 163073164
4 185122087
3 255242000
8 255255255
3 000162232
1 181230029
1 127127127
1 136000021
3 200191231
我想使用gnuplot的直方图样式,用不同的颜色绘制每个颜色条。
我已经尝试使用"lc variable",但它并没有起作用。 :-(
目前我的GNUPLOT脚本:
set style data histograms
set boxwidth 1
set grid
set style histogram cluster gap 0
set style fill solid 1.0 border -1
set yrange [0:*]
set xrange [0:*]
set xtics border in scale 0,10  nomirror rotate by -45  offset character 0, 0, 0 left
plot "histo.dat" using 1:xticlabels(2) lc variable no title
#EOF
我遇到了这个错误信息:
gnuplot> plot "histo.dat" using 1:xticlabels(2) lc variable no title
                                              ^
         "histo.plt", line 9: Bad data on line 1
有人能给我一些提示或正确的命令吗?
最好的祝福,Robert