水平(侧向)直方图 - gnuplot

5

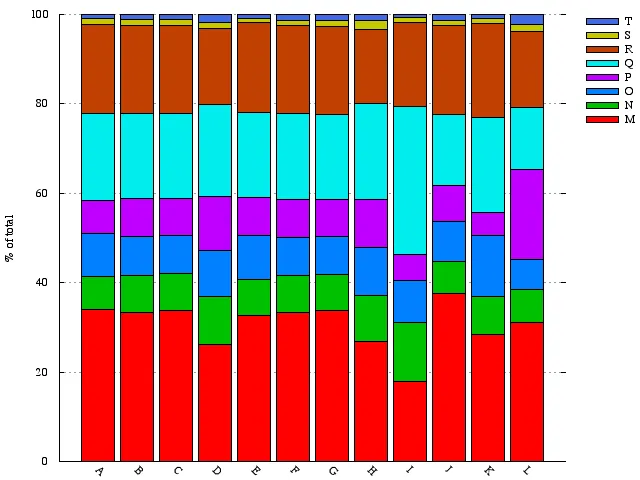
我的问题是在gnuplot中是否有制作水平直方图的方法? 以下是用于直方图绘制的虚构数据集:

sample  M   N   O   P   Q   R   S   T   Total
A   39.17   8.33    11.07   8.57    22.20   22.93   1.47    1.13    114.87
B   61.68   15.53   16.23   15.55   35.68   36.35   2.32    2.23    185.58
C   30.20   7.35    7.55    7.48    16.90   17.50   1.18    1.10    89.25
D   12.57   5.18    4.98    5.77    9.88    8.18    0.67    0.83    48.07
E   36.80   9.00    11.07   9.43    21.43   22.63   0.93    1.03    112.33
F   62.05   15.57   15.95   15.70   35.68   36.63   2.27    2.47    186.32
G   30.23   7.33    7.55    7.48    17.10   17.68   1.10    1.25    89.70
H   12.97   4.87    5.22    5.18    10.37   7.90    0.98    0.70    48.18
I   17.67   12.80   9.40    5.67    32.47   18.53   1.13    0.63    98.30
J   72.30   13.70   17.43   15.43   30.62   38.43   2.25    2.43    192.60
K   25.70   7.58    12.45   4.60    19.30   18.88   1.10    0.80    90.40
L   16.15   3.80    3.53    10.43   7.27    8.80    0.88    1.10    51.97

我从这里改编了代码以绘制直方图:
    set terminal png font "Times-Roman,9" 
    set output 'sample.png'
    set border 3 front linetype -1 linewidth 1.000
    set boxwidth 0.85 absolute
    set style fill   solid 1.00 border lt -1
    set grid nopolar
    set grid noxtics nomxtics ytics nomytics noztics nomztics \
    nox2tics nomx2tics noy2tics nomy2tics nocbtics nomcbtics
    set grid layerdefault   linetype 0 linewidth 1.000,  linetype 0 linewidth 1.000
    set key outside right top vertical Left reverse noenhanced autotitles columnhead nobox
    set key invert samplen 4 spacing 1 width 0 height 0 
    set style histogram rowstacked title  offset character 0, 0, 0
    set datafile missing '-'
    set style data histograms
    #set style histogram gap 1
    set xtics border in scale 0,0 nomirror rotate by -45  offset character 0, 0, 0 autojustify
    set xtics  norangelimit font ",8"
    set xtics   ()
    #set noytics
    set ylabel "% of total" 
    set yrange [ 0 : 100 ] #noreverse nowriteback
    plot 'sample.txt' using (100.*$2/$10):xtic(1) t column(2), for [i=3:9] '' using (100.*column(i)/column(10)) title column(i)

这给了我:

Histogram

有没有一种方法可以让gnuplot横向显示?

据我所知,gnuplot目前不支持水平直方图。 - mgilson
没错,gnuplot默认不支持水平直方图,但是可以通过一些变通方法实现:1.使用
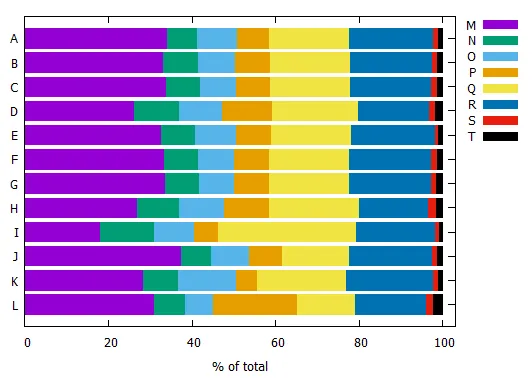
boxxyerrorbars绘图样式,参见Gnuplot交换轴;2.使用y2轴,旋转标签并在最后旋转整个图表,参见有没有办法在gnuplot中绘制bean图?。后者无法与自动键一起使用。 - Christoph
1个回答

1
这是一个相当老的问题,但仍未得到解答。如@Christoph所建议,绘图风格boxxyerror是解决方法。然而,到目前为止我还没有看到示例代码,例如在gnuplot演示页面上。就我所知,gnuplot 5.2.8和可能的5.4仍没有水平堆叠柱状图绘图风格(如果我错了,请纠正我)。实际上,“总计”列并不是必需的,因为gnuplot可以自动进行总和计算。我想自从4.6.0版本以来,函数sum就已经可用了。通过“总计”列,即使在早期版本中也可能需要一些调整就可以工作(但那时没有stats)。更新:将boxxyerror从6列更改为较短的4列语法。检查help boxxyerror。自动提取数据列数。gnuplot>=5.x具有STATS_columns数据: SO19800832.dat

sample M       N       O       P       Q       R       S      T      Total
A      39.17    8.33   11.07    8.57   22.20   22.93   1.47   1.13   114.87
B      61.68   15.53   16.23   15.55   35.68   36.35   2.32   2.23   185.58
C      30.20    7.35    7.55    7.48   16.90   17.50   1.18   1.10    89.25
D      12.57    5.18    4.98    5.77    9.88    8.18   0.67   0.83    48.07
E      36.80    9.00   11.07    9.43   21.43   22.63   0.93   1.03   112.33
F      62.05   15.57   15.95   15.70   35.68   36.63   2.27   2.47   186.32
G      30.23    7.33    7.55    7.48   17.10   17.68   1.10   1.25    89.70
H      12.97    4.87    5.22    5.18   10.37    7.90   0.98   0.70    48.18
I      17.67   12.80    9.40    5.67   32.47   18.53   1.13   0.63    98.30
J      72.30   13.70   17.43   15.43   30.62   38.43   2.25   2.43   192.60
K      25.70    7.58   12.45    4.60   19.30   18.88   1.10   0.80    90.40
L      16.15    3.80    3.53   10.43    7.27    8.80   0.88   1.10    51.97

脚本:(适用于gnuplot>=4.6.0,2012年3月)

### horizontal stacked histogram
reset

FILE = "SO19800832.dat"

set xlabel "% of total"
set xrange [0:103]
set yrange [:] reverse
set offsets 0,0,0.5,0.5
set style fill solid 1.0
set key out

# automatic extraction of number of columns
set datafile separator "@"     # some character which does not appear in the file
stats FILE u (ColCount=words(strcol(1))-2) nooutput
set datafile separator whitespace

myBoxwidth = 0.8

plot for [col=2:ColCount+1] FILE u (total=sum [i=2:ColCount+1] column(i), \
     x0=column(col),((sum [i=2:col-1] column(i))+x0/2.)/total*100):0: \
     (x0/2./total*100):(myBoxwidth/2.):ytic(1) w boxxy ti columnhead(col)
### end of script

结果:

enter image description here


网页内容由stack overflow 提供, 点击上面的
可以查看英文原文,
原文链接