如何在Seaborn的FacetGrid中设置可读的xticks?

26

我有一个带有Seaborn's FacetGrid的数据框绘图:

import seaborn as sns
import matplotlib.pylab as plt
import pandas
import numpy as np

plt.figure()
df = pandas.DataFrame({"a": map(str, np.arange(1001, 1001 + 30)),
                       "l": ["A"] * 15 + ["B"] * 15,
                       "v": np.random.rand(30)})
g = sns.FacetGrid(row="l", data=df)
g.map(sns.pointplot, "a", "v")
plt.show()

seaborn将所有xtick标签绘制出来,而不仅仅选取一些,这看起来很糟糕:

enter image description here

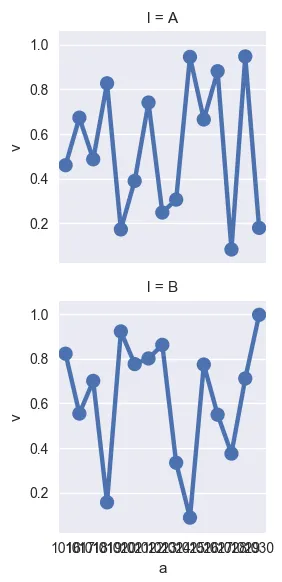
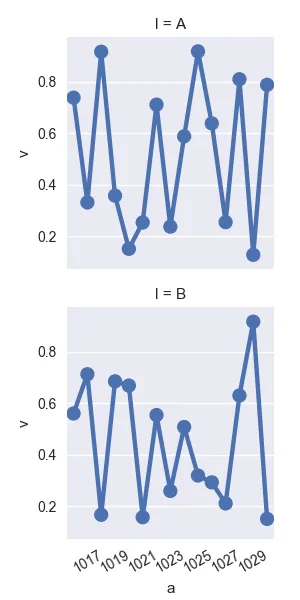
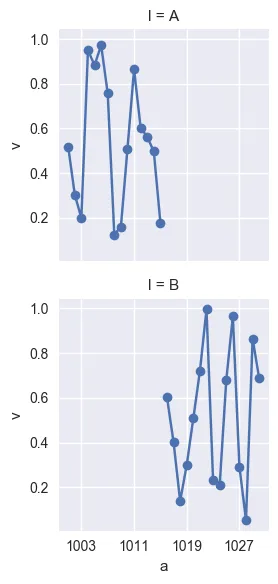
有没有办法自定义它,以便在x轴上绘制每个第n个刻度,而不是全部绘制?


1
你可能想在这里使用 plt.plot,因为 a 看起来应该是数值型的。 - mwaskom
2个回答

33

你需要手动跳过 x 个标签,就像这个例子:

import seaborn as sns
import matplotlib.pylab as plt
import pandas
import numpy as np

df = pandas.DataFrame({"a": range(1001, 1031),
                       "l": ["A",] * 15 + ["B",] * 15,
                       "v": np.random.rand(30)})
g = sns.FacetGrid(row="l", data=df)
g.map(sns.pointplot, "a", "v")

# iterate over axes of FacetGrid
for ax in g.axes.flat:
    labels = ax.get_xticklabels() # get x labels
    for i,l in enumerate(labels):
        if(i%2 == 0): labels[i] = '' # skip even labels
    ax.set_xticklabels(labels, rotation=30) # set new labels
plt.show()

enter image description here


18

seaborn.pointplot 不是这种图形的正确工具。但答案非常简单:使用基本的 matplotlib.pyplot.plot 函数:

答案很简单,使用基本的 matplotlib.pyplot.plot 函数即可,不要使用 seaborn.pointplot

import seaborn as sns
import matplotlib.pylab as plt
import pandas
import numpy as np

df = pandas.DataFrame({"a": np.arange(1001, 1001 + 30),
                       "l": ["A"] * 15 + ["B"] * 15,
                       "v": np.random.rand(30)})
g = sns.FacetGrid(row="l", data=df)
g.map(plt.plot, "a", "v", marker="o")
g.set(xticks=df.a[2::8])

在此输入图片描述


这是一个简化的解决方案,如果组共享相同的数字值,则无法工作:df = pd.DataFrame({"a":np.tile(np.arange(1001, 1001 + 15), 2),"l":["A"] * 15 + ["B"] * 15,"v":np.random.rand(30)}) - Parfait

网页内容由stack overflow 提供, 点击上面的
可以查看英文原文,
原文链接