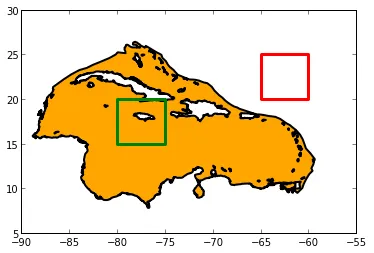
我有一组经纬度点的数组,用于定义一个区域的边界。我想基于这些点创建一个多边形,并在地图上绘制和填充该多边形。目前,我的多边形似乎由许多连接所有点的补丁组成,但是点的顺序不正确,当我尝试填充多边形时,会得到一个奇怪的区域(请参见附图)。我对我的经纬度点(mypolyXY 数组)进行排序以便根据多边形的中心点,但我猜想这并不正确:
我使用以下方法绘制点的位置(黑色圆圈)和多边形(彩色图案):
我的问题是:如何基于我的经纬度点数组关闭多边形?
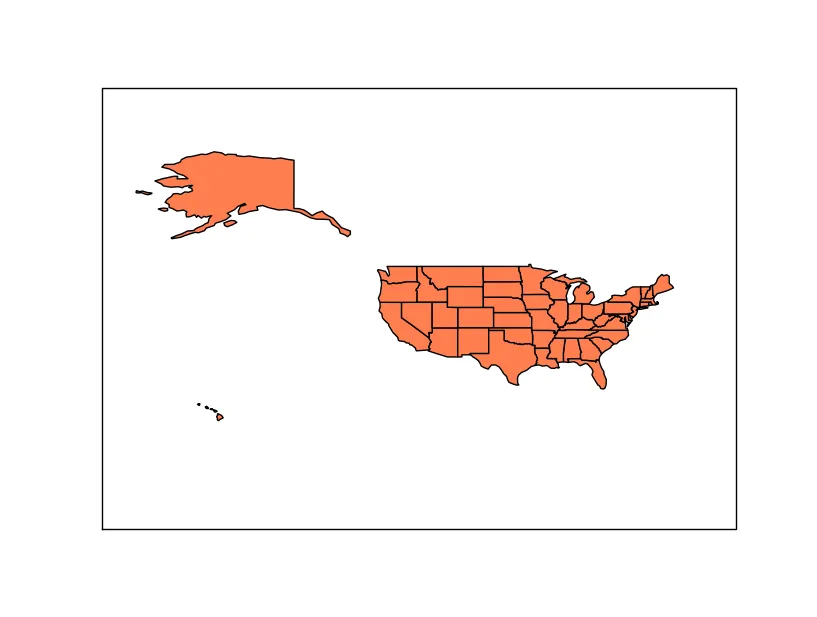
更新: 我试着测试了一些绘制多边形的方法。我删除了排序程序,只使用出现在文件中的数据顺序。这似乎改善了结果,但正如@tcaswell所提到的,多边形形状仍然会相互重叠(请参见新图)。我希望能够找到一种路径/多边形程序来解决我的问题,并将所有形状或路径合并到多边形的边界内。欢迎提出建议。
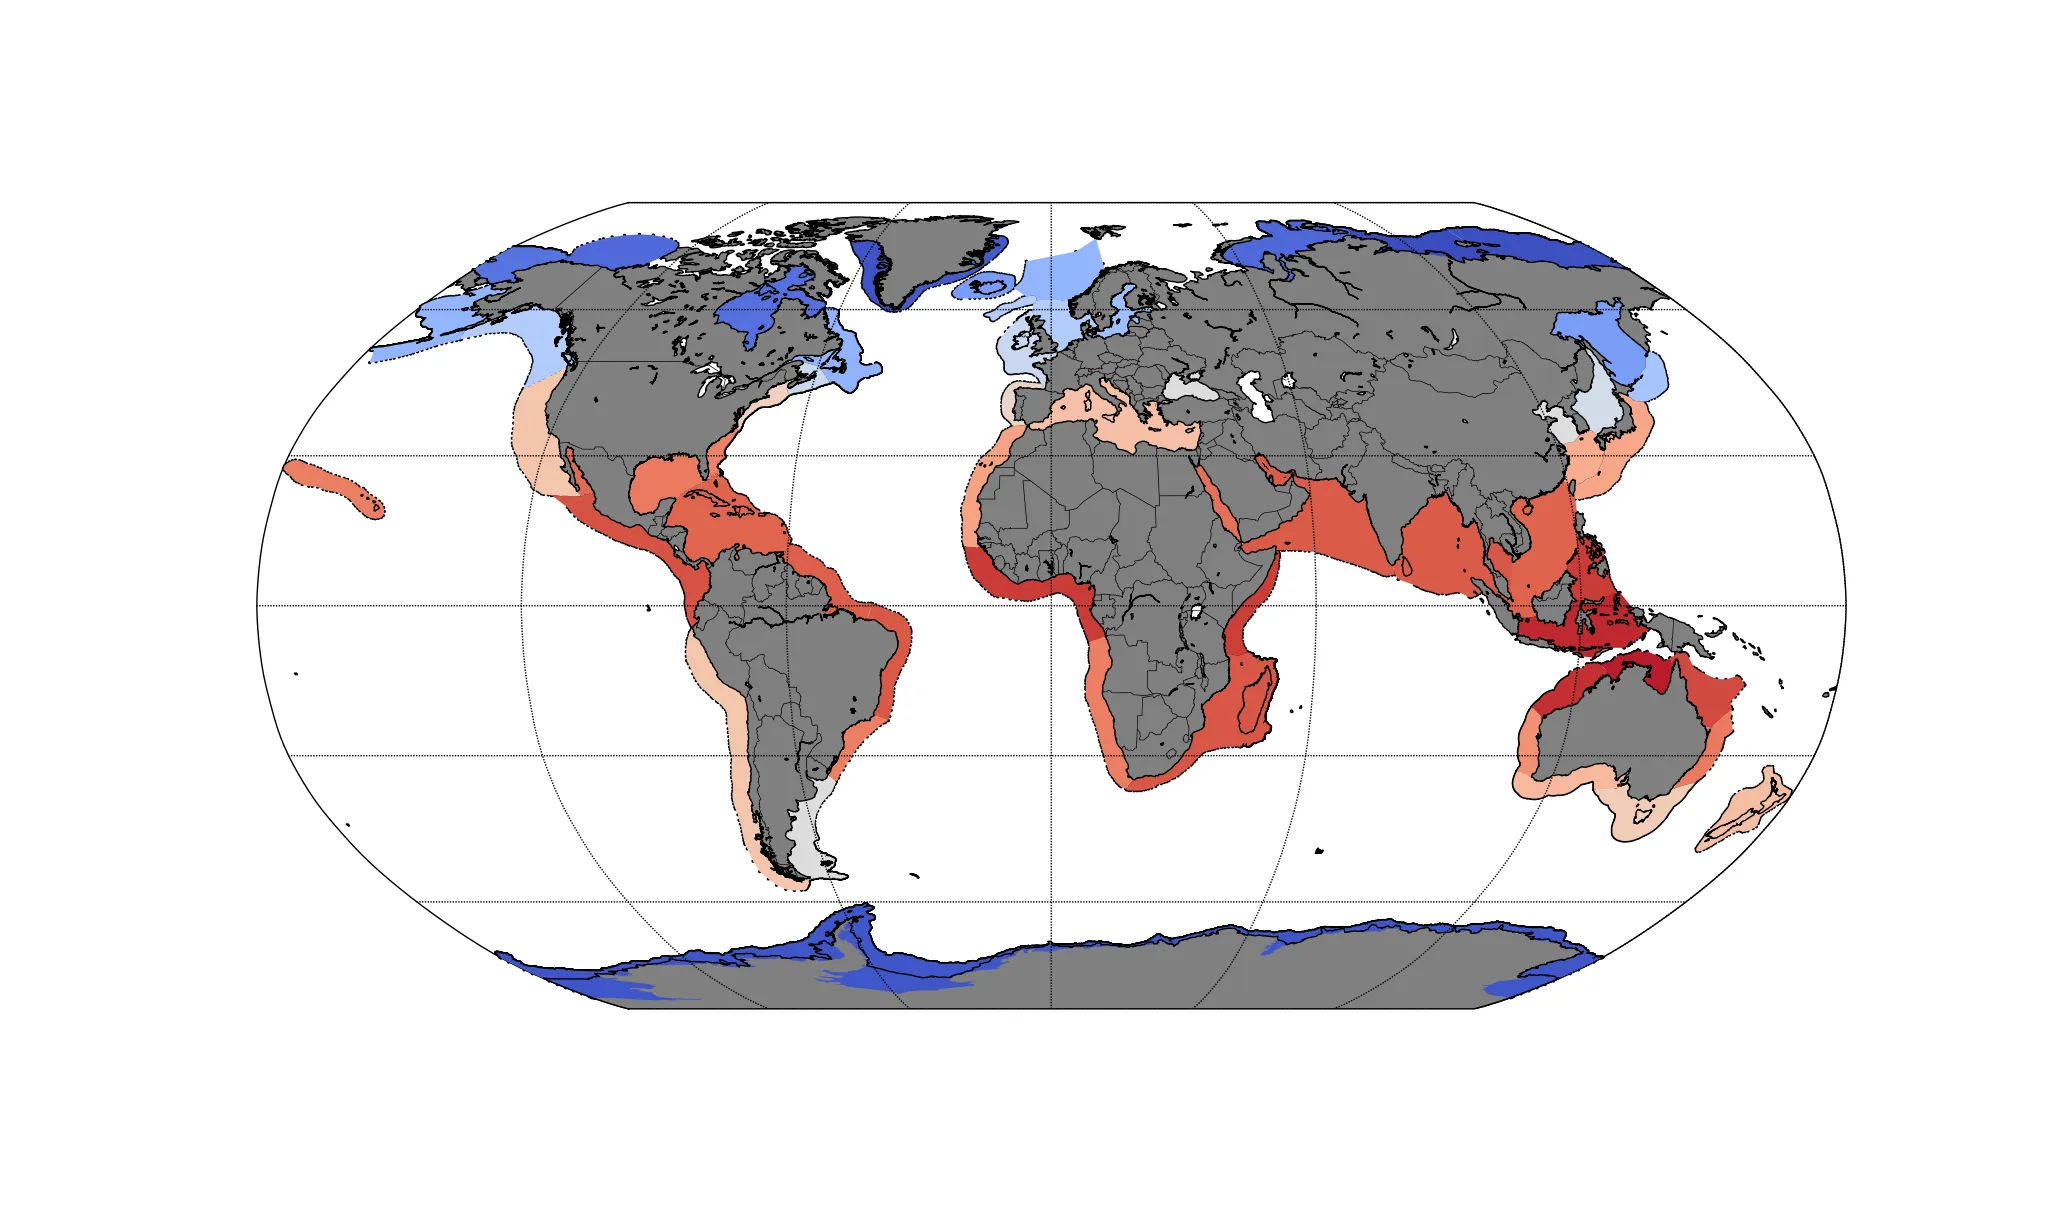
更新2: 现在我有一个基于@Rutger Kassies和Roland Smith建议的脚本版本。最终我使用了org读取了Shapefile,效果还不错。它适用于标准的lmes_64.shp文件,但是当我使用更详细的LME文件时,每个LME可能由多个多边形组成,此脚本就会崩溃。我需要找到一种方法来合并相同LME名称的各个多边形才能使其正常工作。我附上我最终得到的脚本,在此感谢任何人对如何改进或使其更通用的脚本提供评论。此脚本创建多边形并提取该区域内从netcdf文件读取的数据。输入文件的网格是-180到180和-90到90。
cent=(np.sum([p[0] for p in mypolyXY])/len(mypolyXY),np.sum([p[1] for p in mypolyXY])/len(mypolyXY))
# sort by polar angle
mypolyXY.sort(key=lambda p: math.atan2(p[1]-cent[1],p[0]-cent[0]))
我使用以下方法绘制点的位置(黑色圆圈)和多边形(彩色图案):
scatter([p[0] for p in mypolyXY],[p[1] for p in mypolyXY],2)
p = Polygon(mypolyXY,facecolor=colors,edgecolor='none')
ax.add_artist(p)
我的问题是:如何基于我的经纬度点数组关闭多边形?
更新: 我试着测试了一些绘制多边形的方法。我删除了排序程序,只使用出现在文件中的数据顺序。这似乎改善了结果,但正如@tcaswell所提到的,多边形形状仍然会相互重叠(请参见新图)。我希望能够找到一种路径/多边形程序来解决我的问题,并将所有形状或路径合并到多边形的边界内。欢迎提出建议。
更新2: 现在我有一个基于@Rutger Kassies和Roland Smith建议的脚本版本。最终我使用了org读取了Shapefile,效果还不错。它适用于标准的lmes_64.shp文件,但是当我使用更详细的LME文件时,每个LME可能由多个多边形组成,此脚本就会崩溃。我需要找到一种方法来合并相同LME名称的各个多边形才能使其正常工作。我附上我最终得到的脚本,在此感谢任何人对如何改进或使其更通用的脚本提供评论。此脚本创建多边形并提取该区域内从netcdf文件读取的数据。输入文件的网格是-180到180和-90到90。
import numpy as np
import math
from pylab import *
import matplotlib.patches as patches
import string, os, sys
import datetime, types
from netCDF4 import Dataset
import matplotlib.nxutils as nx
from mpl_toolkits.basemap import Basemap
import ogr
import matplotlib.path as mpath
import matplotlib.patches as patches


def getLMEpolygon(coordinatefile,mymap,index,first):

    ds = ogr.Open(coordinatefile)
    lyr = ds.GetLayer(0)
    numberOfPolygons=lyr.GetFeatureCount()

    if first is False:
        ft = lyr.GetFeature(index)
        print "Found polygon:",  ft.items()['LME_NAME']
        geom = ft.GetGeometryRef()

        codes = []
        all_x = []
        all_y = []
        all_XY= []

        if (geom.GetGeometryType() == ogr.wkbPolygon):
          for i in range(geom.GetGeometryCount()):

            r = geom.GetGeometryRef(i)
            x = [r.GetX(j) for j in range(r.GetPointCount())]
            y = [r.GetY(j) for j in range(r.GetPointCount())]

            codes += [mpath.Path.MOVETO] + (len(x)-1)*[mpath.Path.LINETO]
            all_x += x
            all_y += y
            all_XY +=mymap(x,y)


        if len(all_XY)==0:
            all_XY=None
            mypoly=None
        else:
            mypoly=np.empty((len(all_XY[:][0]),2))
            mypoly[:,0]=all_XY[:][0]
            mypoly[:,1]=all_XY[:][3]
    else:
        print "Will extract data for %s polygons"%(numberOfPolygons)
        mypoly=None
    first=False
    return mypoly, first, numberOfPolygons


def openCMIP5file(CMIP5name,myvar,mymap):
    if os.path.exists(CMIP5name):
        myfile=Dataset(CMIP5name)
        print "Opened CMIP5 file: %s"%(CMIP5name)
    else:
        print "Could not find CMIP5 input file %s : abort"%(CMIP5name)
        sys.exit()
    mydata=np.squeeze(myfile.variables[myvar][-1,:,:]) - 273.15
    lonCMIP5=np.squeeze(myfile.variables["lon"][:])
    latCMIP5=np.squeeze(myfile.variables["lat"][:])

    lons,lats=np.meshgrid(lonCMIP5,latCMIP5)

    lons=lons.flatten()
    lats=lats.flatten()
    mygrid=np.empty((len(lats),2))
    mymapgrid=np.empty((len(lats),2))

    for i in xrange(len(lats)):
        mygrid[i,0]=lons[i]
        mygrid[i,1]=lats[i]
        X,Y=mymap(lons[i],lats[i])
        mymapgrid[i,0]=X
        mymapgrid[i,1]=Y

    return mydata, mygrid, mymapgrid

def drawMap(NUM_COLORS):

    ax = plt.subplot(111)
    cm = plt.get_cmap('RdBu')
    ax.set_color_cycle([cm(1.*j/NUM_COLORS) for j in range(NUM_COLORS)])
    mymap = Basemap(resolution='l',projection='robin',lon_0=0)

    mymap.drawcountries()

    mymap.drawcoastlines()
    mymap.fillcontinents(color='grey',lake_color='white')
    mymap.drawparallels(np.arange(-90.,120.,30.))
    mymap.drawmeridians(np.arange(0.,360.,60.))
    mymap.drawmapboundary(fill_color='white')

    return ax, mymap, cm

"""Edit the correct names below:"""

LMEcoordinatefile='ShapefileBoundaries/lmes_64.shp'
CMIP5file='tos_Omon_CCSM4_rcp85_r1i1p1_200601-210012_regrid.nc'

mydebug=False
doPoints=False
first=True


"""initialize the map:"""
mymap=None
mypolyXY, first, numberOfPolygons = getLMEpolygon(LMEcoordinatefile, mymap, 0,first)
NUM_COLORS=numberOfPolygons
ax, mymap, cm = drawMap(NUM_COLORS)


"""Get the CMIP5 data together with the grid"""
SST,mygrid, mymapgrid = openCMIP5file(CMIP5file,"tos",mymap)

"""For each LME of interest create a polygon of coordinates defining the boundaries"""
for counter in xrange(numberOfPolygons-1):

    mypolyXY,first,numberOfPolygons = getLMEpolygon(LMEcoordinatefile, mymap,counter,first)

    if mypolyXY != None:
        """Find the indices inside the grid that are within the polygon"""
        insideBoolean = plt.mlab.inside_poly(np.c_[mymapgrid[:,0],mymapgrid[:,1]],np.c_[mypolyXY[:,0],mypolyXY[:,1]])
        SST=SST.flatten()
        SST=np.ma.masked_where(SST>50,SST)

        mymapgrid=np.c_[mymapgrid[:,0],mymapgrid[:,1]]
        myaverageSST=np.mean(SST[insideBoolean])

        mycolor=cm(myaverageSST/SST.max())
        scaled_z = (myaverageSST - SST.min()) / SST.ptp()
        colors = plt.cm.coolwarm(scaled_z)

        scatter([p[0] for p in mypolyXY],[p[1] for p in mypolyXY],2)

        p = Polygon(mypolyXY,facecolor=colors,edgecolor='none')
        ax.add_artist(p)

        if doPoints is True:

            for point in xrange(len(insideBoolean)):
                pointX=mymapgrid[insideBoolean[point],0]
                pointY=mymapgrid[insideBoolean[point],1]
                ax.scatter(pointX,pointY,8,color=colors)
                ax.hold(True)


if doPoints is True:
    colorbar()
print "Extracted average values for %s LMEs"%(numberOfPolygons)
plt.savefig('LMEs.png',dpi=300)
plt.show()
附上最终图片。感谢所有的帮助。
 祝好,Trond