当使用stat="count"时,重新按从高到低排序geom_bar

15

当使用stat="count"时,我想重新排列一个geom_bar图形,使其从高到低排序,以便我可以应用填充。

我尝试使用geom_bar(aes(x=reorder(x, -stat(count)), fill=type),但它没有起作用,并抛出错误“Error: stat_count requires the following missing aesthetics: x”。

library(ggplot2)
df <- data.frame(x = c("Bob", "James", "Mary", "Sally", "Timmy", "Sally", "Sally", "Bob", "Bob", "Mary"), type = c("A", "B", "A", "B", "B", "C", "B", "B", "A", "B"))
ggplot(df) +
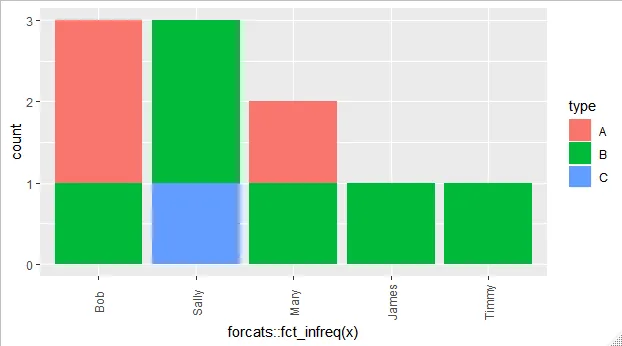
  geom_bar(aes(x = x, fill = type), stat = "count") +
  theme(axis.text.x = element_text(angle = 90, vjust = 0.5))

我希望条形图从左到右按计数从高到低的顺序排列。

2个回答

17

我不确定是否有 ggplot2 的解决方案,但我会使用 forcats 包来解决。该包提供了一个函数 fct_infreq() 可以根据频率设置因子水平。

然后你可以进行如下操作:

ggplot(df) +
    geom_bar(aes(x = forcats::fct_infreq(x), fill = type)) +
    theme(axis.text.x = element_text(angle = 90, vjust = 0.5))

输入图像描述


11

这里有一个使用 ggplot2 中的 reorder 函数的解决方案:

首先,您需要按名称计算出现次数:

df2 <- df %>% group_by(x) %>%   mutate(count_name_occurr = n())

然后,在指定x轴时,您需要按照名称出现次数降序重新排序x轴。

g2<-ggplot(data=df2, aes(x=reorder(x,-count_name_occurr), fill=type)) +
  geom_bar(stat="count")
g2

网页内容由stack overflow 提供, 点击上面的
可以查看英文原文,
原文链接