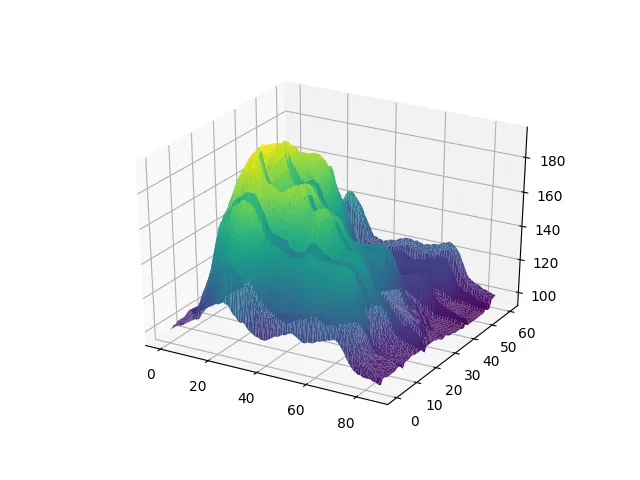
我想尝试重现一个代表山峰轮廓的3D曲面图。我了解到需要创建一个csv文件以读取代码,并尝试从谷歌地球获取坐标。有人能建议一种方法吗?是否有代码可以完成这种工作?
我试着按照以下代码进行操作:
感谢大家。
# library
from mpl_toolkits.mplot3d import Axes3D
import matplotlib.pyplot as plt
import pandas as pd
import seaborn as sns

# Get the data (csv file is hosted on the web)
url = 'https://python-graph-gallery.com/wp-content/uploads/volcano.csv'
data = pd.read_csv(url)

# Transform it to a long format
df=data.unstack().reset_index()
df.columns=["X","Y","Z"]

# And transform the old column name in something numeric
df['X']=pd.Categorical(df['X'])
df['X']=df['X'].cat.codes

# Make the plot
fig = plt.figure()
ax = fig.gca(projection='3d')
ax.plot_trisurf(df['Y'], df['X'], df['Z'], cmap=plt.cm.viridis,
linewidth=0.2)
plt.show()

# to Add a color bar which maps values to colors.
surf=ax.plot_trisurf(df['Y'], df['X'], df['Z'], cmap=plt.cm.viridis,
linewidth=0.2)
fig.colorbar( surf, shrink=0.5, aspect=5)
plt.show()

# Rotate it
ax.view_init(30, 45)
plt.show()

# Other palette
ax.plot_trisurf(df['Y'], df['X'], df['Z'], cmap=plt.cm.jet, linewidth=0.01)
plt.show()
感谢大家。