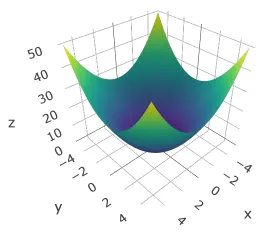
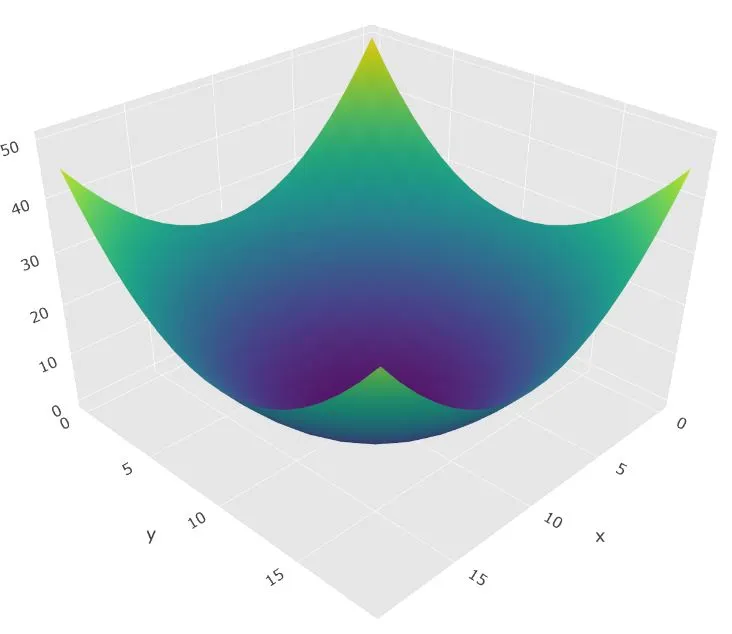
尝试使用plotly (go.Surface)绘制交互式3D曲面,结果曲面未居中于原点。它居中于(10,10),轴从0到20。我希望它居中于原点,轴被限制在-5到5之间。如果有人能帮助我做到这一点就太好了。
x = np.arange(-5,5,0.01)
y = np.arange(-5,5,0.01)
xx,yy=np.meshgrid(x,y)
Z=xx**2+yy**2

data = [go.Surface(z=Z.tolist(), colorscale='Viridis')]

layout = go.Layout(
...
code here
...
)

fig = dict(data=data, layout=layout)

plotly.offline.plot(fig, filename='pandas-3d-surface')