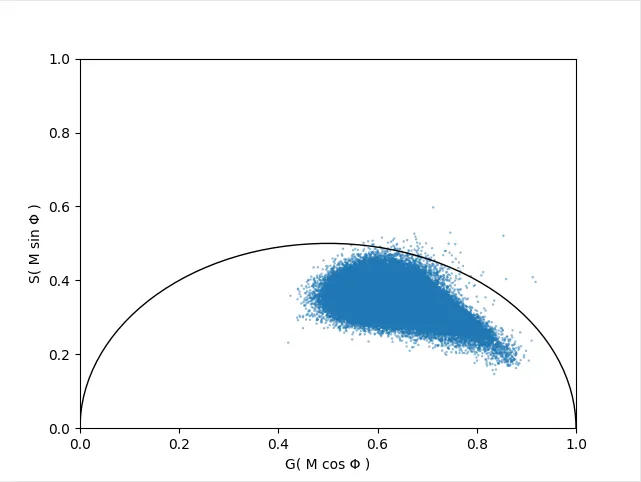
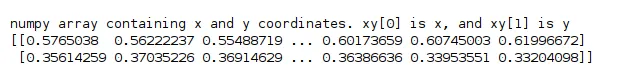
我需要找到两个相距最远的点。如截图所示,我有一个包含两个其他数组(一个用于X坐标,一个用于Y坐标)的数组。确定通过数据的最长线的最佳方法是什么?换句话说,我需要在图中选择两个距离最远的点。希望您们能够提供帮助。以下是一些截图以帮助解释问题。
import numpy as np
from scipy import spatial
# test points
pts = np.random.rand(100_000, 2)
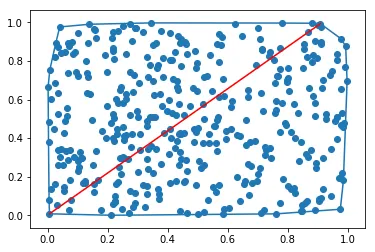
# two points which are fruthest apart will occur as vertices of the convex hull
candidates = pts[spatial.ConvexHull(pts).vertices]
# get distances between each pair of candidate points
dist_mat = spatial.distance_matrix(candidates, candidates)
# get indices of candidates that are furthest apart
i, j = np.unravel_index(dist_mat.argmax(), dist_mat.shape)
print(candidates[i], candidates[j])
# e.g. [ 1.11251218e-03 5.49583204e-05] [ 0.99989971 0.99924638]
O(N*log(N))时间内计算凸包,其中N是点的数量。由于测度集中,随着维度数量的增加,这种方法在许多常见分布中的性能会恶化。计算所有点之间的成对距离,选择最远的两个点。
简化示例,代码:
# Standalone basic example with random data, simplified example

import numpy as np

from scipy.spatial import distance

# Generate a set of random points
pts = np.random.rand(100, 2)

distances = distance.cdist(pts, pts, 'euclidean')

maxarg = np.unravel_index(distances.argmax(), distances.shape)

print('Matrix indices of the two farthest points: %s' % (maxarg,))

print('Farthest point #1 (coords): %s' % pts[maxarg[0]])
print('Farthest point #2 (coords): %s' % pts[maxarg[1]])
示例输出:
Matrix indices of the two farthest points: (11, 20)
Farthest point #1 (coords): [0.06505425 0.00118619]
Farthest point #2 (coords): [0.96760093 0.97164817]
代码:
# Standalone basic example with random data, including visualization

import numpy as np
import matplotlib.pyplot as plt

from matplotlib.lines import Line2D
from scipy.spatial import distance

# Generate a set of random points
pts = np.random.rand(100, 2)

distances = distance.cdist(pts, pts, 'euclidean')

maxarg = np.unravel_index(distances.argmax(), distances.shape)

print('Matrix indices of the two farthest points: %s' % (maxarg,))

print('Farthest point #1 (coords): %s' % pts[maxarg[0]])
print('Farthest point #2 (coords): %s' % pts[maxarg[1]])


# Check that the farthest distance is the same
print(distances.max())
print(distances[(maxarg)])

# Fixed size of the visualization canvas (a square)
plt.rcParams["figure.figsize"] = (10, 10)

fig = plt.figure()

ax = fig.add_subplot(111)

plt.scatter(pts.T[0], pts.T[1])

line = Line2D([pts[maxarg[0]][0], pts[maxarg[1]][0]],
              [pts[maxarg[0]][1], pts[maxarg[1]][1]],
              color='r')

ax.add_line(line)

plt.show()
示例输出:
Matrix indices of the two farthest points: (11, 20)
Farthest point #1 (coords): [0.06505425 0.00118619]
Farthest point #2 (coords): [0.96760093 0.97164817]
1.3252875045947154
1.3252875045947154
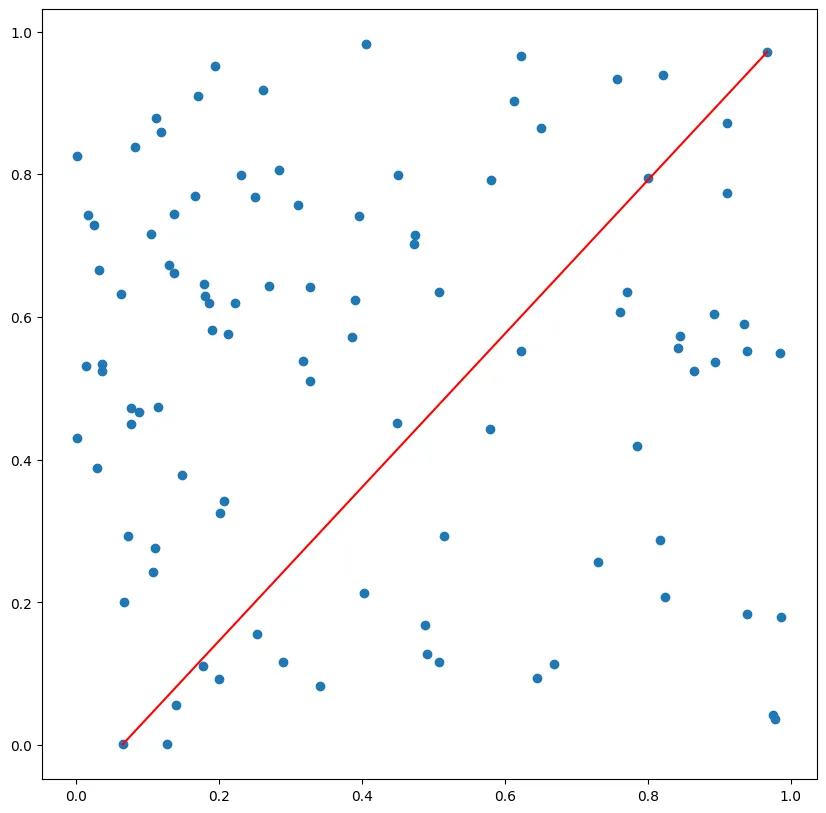
我发布此答案的原因:
@hilberts_drinking_problem 指出可以使用简单的成对距离度量,但是他发布的代码包括更复杂的凸包方法。对于简单问题(最多几百个点),scipy 的距离矩阵就足够了。
在以前的答案中没有包括可视化的代码,对于一些用例来说这可能非常重要(用于验证结果),至少在我的情况下是这样。