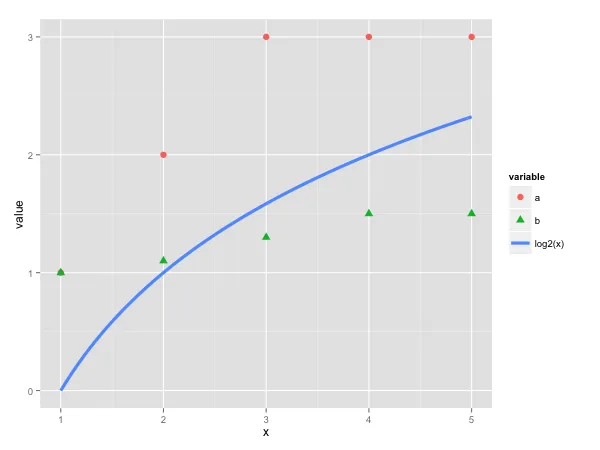
我有一个包含多个geom_point和单个stat_function的图形,有没有办法只显示一个图例?
df <- data.frame("x"=c(1:5), "a"=c(1,2,3,3,3), "b"=c(1,1.1,1.3,1.5,1.5))
df <- melt(df, "x")
p <- ggplot(df, aes(x=x, y=value)) +
  geom_point(aes(colour=variable, shape=variable)) +
  stat_function(aes(colour="log2(x)"), fun=log2)
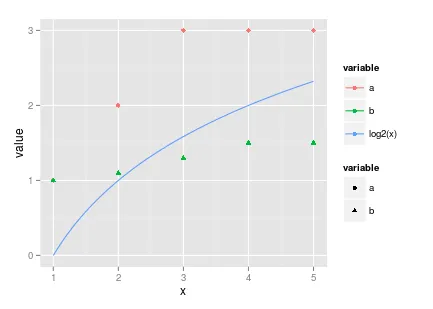
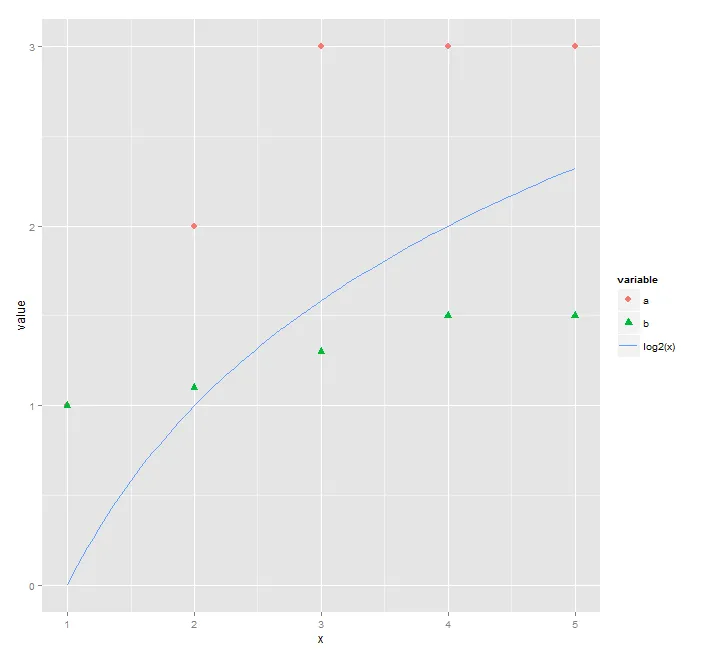
我希望在图例中同时显示蓝线和两个彩色形状。我尝试过,但未能成功。
scale_colour_discrete(name="legend", breaks=c("a", "b", "log2(x)")) +
scale_shape_discrete(name="legend", breaks=c("a", "b"))
但这种方法不起作用。有没有自动或手动的方法可以做到这一点?
提前致谢。