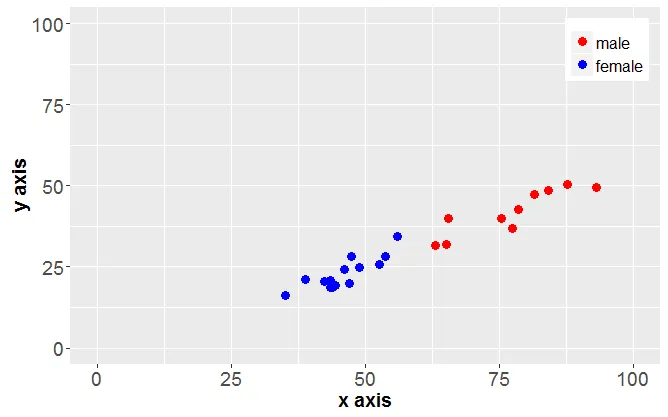
我希望将图例放置在绘图区域内(左上角),并且需要删除图例标题。以下是我的代码:
male <- structure(list(x1 = c(77.34,75.37,63.10,81.43,87.63,93.02,65.53,84.10,65.15,78.56), y1 = c(36.95,40.05,31.60,47.47,50.36,49.48,39.90,48.43,32.00,42.79)), .Names = c("x1", "y1"), class = "data.frame", row.names = c(NA,-10L))
female <- structure(list(x2 = c(42.39,38.77,44.43,42.37,48.79,46.00,53.71,47.38,43.75,46.95,52.62,43.50,55.91,43.45,35.02), y2 = c(20.65,21.28,19.27,20.49,24.99,24.21,28.16,28.15,18.82,20.03,25.90,18.54,34.40,20.80,16.31)), .Names = c("x2", "y2"), class = "data.frame", row.names = c(NA, -15L))
library(reshape2)
library(ggplot2)
names(female) <- c("x1", "y2")
df <- rbind(melt(male, id.vars = "x1"), melt(female, id.vars = "x1"))
ggplot(df, aes(x1, y = value, colour = variable)) +
  geom_point(size=3) +theme(axis.text=element_text(size=14),
        axis.title=element_text(size=14,face="bold")) + theme(legend.text=element_text(size=12)) + labs(x = "x axis", y = "y axis")+ ylim(0,100) + xlim(0,100) + scale_colour_manual(values = c("red", "blue"), labels = c("male", "female"))