如何在R中获得以下可视化效果(见下文): 让我们考虑一个简单的三点案例。
# Define two vectors
x <- c(12,21,54)
y <- c(2, 7, 11)
# OLS regression
ols <- lm(y ~ x)
# Visualisation
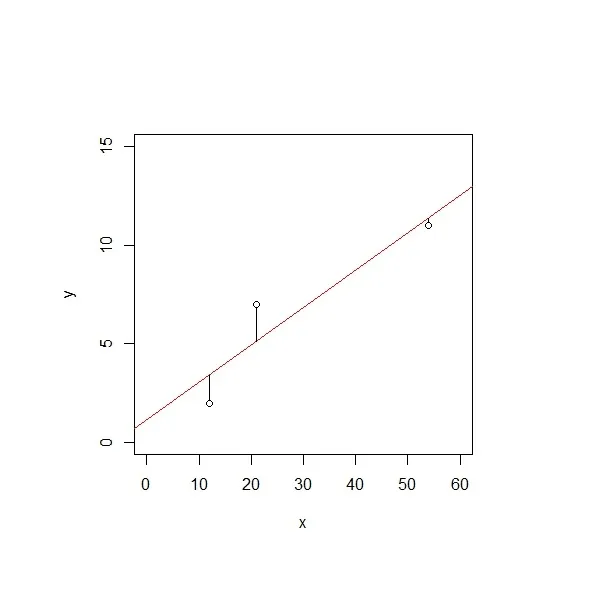
plot(x,y, xlim = c(0,60), ylim =c(0,15))
abline(ols, col="red")
我希望的是,从OLS线(红线)向点绘制垂直距离线。
如何在R中获得以下可视化效果(见下文): 让我们考虑一个简单的三点案例。
# Define two vectors
x <- c(12,21,54)
y <- c(2, 7, 11)
# OLS regression
ols <- lm(y ~ x)
# Visualisation
plot(x,y, xlim = c(0,60), ylim =c(0,15))
abline(ols, col="red")
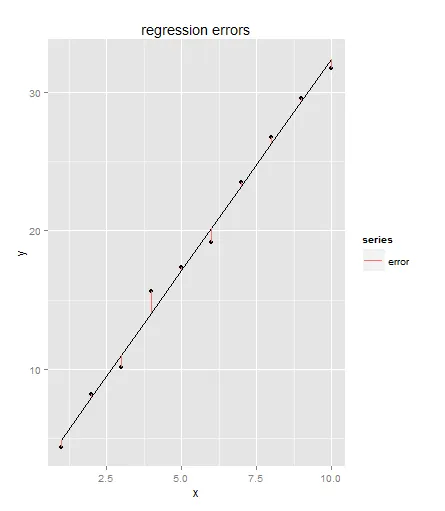
您可以使用 ggplot2 来轻松实现此操作。
library(ggplot2)
set.seed(1)
x<-1:10
y<-3*x + 2 + rnorm(10)
m<-lm(y ~ x)
yhat<-m$fitted.values
diff<-y-yhat
qplot(x=x, y=y)+geom_line(y=yhat)+
       geom_segment(aes(x=x, xend=x, y=y, yend=yhat, color="error"))+
       labs(title="regression errors", color="series")
segments(x, y, x, predict(ols))
col="red" 来使线条变成红色。segments(x, y, x, predict(ols), col="red") - rvbarretocbind(x,x,y,predict(ols))
# x x y
#1 12 12 2 3.450920
#2 21 21 7 5.153374
#3 54 54 11 11.395706
apply(cbind(x,x,y,predict(ols)),1,function(coords){lines(coords[1:2],coords[3:4])})
实际上,这是一个针对矩阵行进行循环处理,并绘制每行数据的线条的for循环。