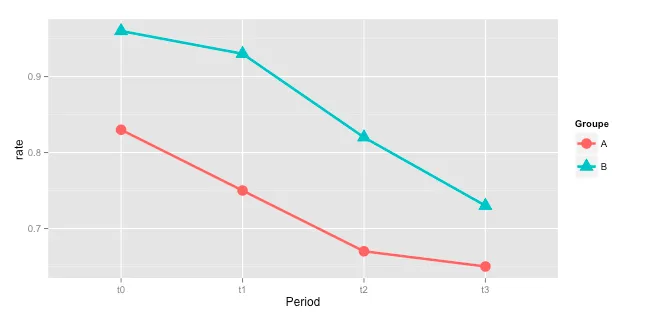
我有一个数据框和一个图形:
df <- data.frame(Groupe = rep(c("A","B"),4),
                 Period = gl(4,2,8,c("t0","t1","t2","t3","t4")),
                 rate = c(0.83,0.96,0.75,0.93,0.67,0.82,0.65,0.73))

ggplot(data = df, mapping = aes(y = rate, x = Period ,group = Groupe, colour=Groupe, shape=Groupe)) +
   geom_line(size=1.2) +
   geom_point(size=5)
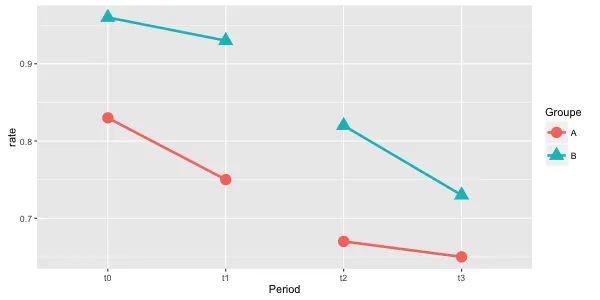
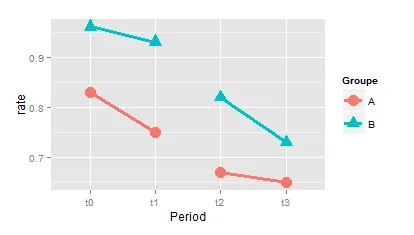
如何组织我的数据,使得在t1和t2之间的点不用线连接?我想让t0和t1相连(按照组别分为蓝色或红色),t2和t3也以同样的方式相连,但是t1和t2之间没有连线。我尝试了几种方法,看着类似的问题,但总是搞乱了我的归组颜色 :/