根据您的评论,Highcharts可以作为Plotly的替代方案。
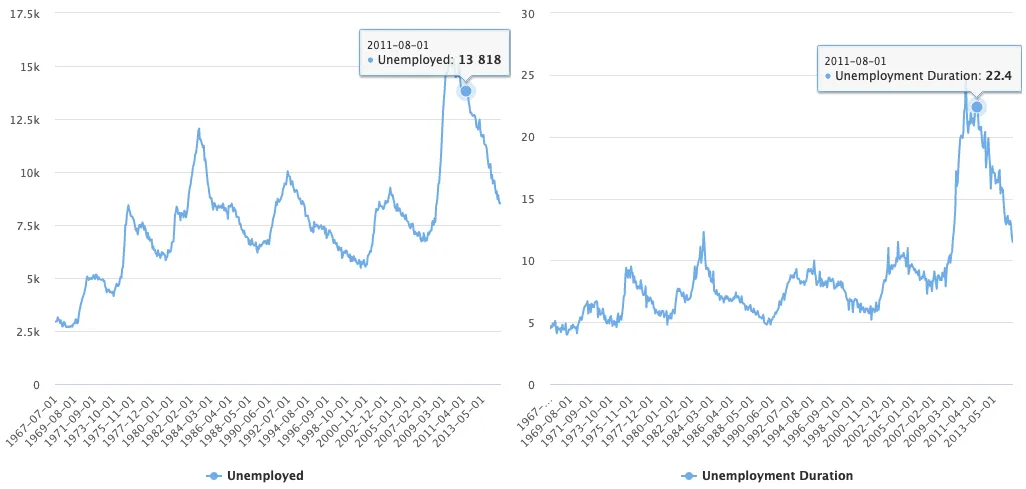
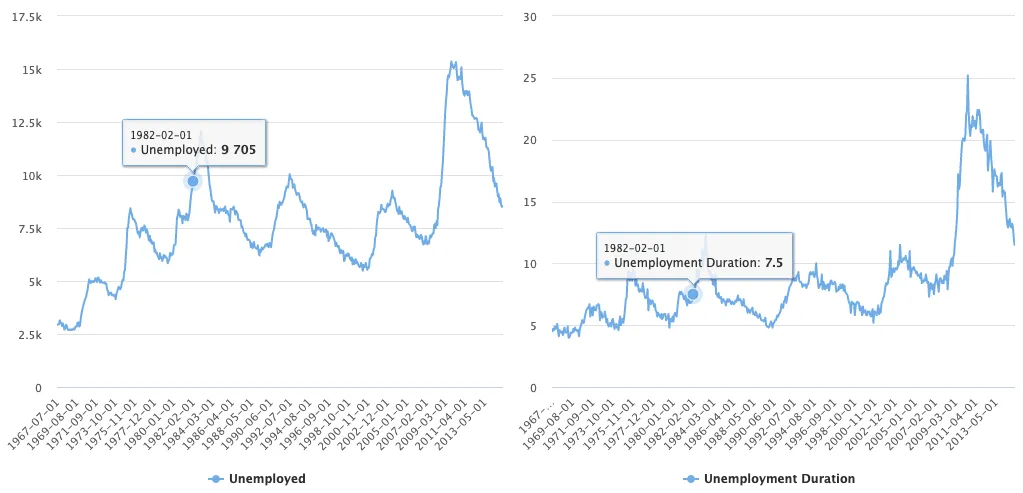
以下是创建两个图表并使其在同步工具提示的解决方案,无论您将光标悬停在左侧还是右侧图表。
你好,来自美国的问候!顺便说一下,如果你没有正确拼写标签名(Kat),SO不会通知我。我碰巧又看到了你的问题。
最终我添加了一些故障保护代码,但这可能只在您只有两个并排图时才能正常工作。由于 economics 中有太多的数据,很多时候两个提示之间会相差一年。额外的代码只是确保它们匹配。
既然我确定使用 economics 不是你的最终目标,请让我知道如果你使用的任何配置无法与此代码配合使用。
我已经在引用的 tags$script 中添加了许多 Javascript 代码的注释。希望这些信息足以让你理解发生了什么。
Highcharts for R 有两种不同的绘图方法。
- 如果你熟悉Python的Plotly,则有两个版本:express和go。这在R的Highcharts中也是类似的。(
hchart()更像是express;highchart()则更像是go)
- 如果你不熟悉Python的Plotly,那么需要知道的是,图表要么以
hchart()开始,要么以highchart()开始。它们的工作方式略有不同。
如果想了解有关R的Highcharts的更多信息,请在此处阅读更多内容。
本答案使用的是economics(与您在问题中使用的相同),它来自库ggplot2。本答案中使用的其他库包括highcharter和htmltools。图表的设置与您在Plotly中所设定的完全相同,只是它们在Highcharter中呈现。
library(highcharter)
library(htmltools)

data(economics, package = 'ggplot2')

(hc1 <- highchart(elementId = "myChart") %>%
    hc_xAxis(categories = economics$date, type = "datetime") %>%
    hc_add_series(name = "Unemployed", data = economics$unemploy) %>%
    hc_tooltip(useHTML = T))

(hc2 <- highchart(elementId = "myChart2") %>%
    hc_xAxis(categories = economics$date, type = "datetime") %>%
    hc_add_series(name = "Unemployment Duration",
                  data = economics$uempmed) %>%
    hc_tooltip(useHTML = T))
这段代码将这两张图表横向对齐并建立了同步工具提示。
browsable(tagList(
  tags$script(HTML("
  setTimeout(function() {                               /* using id from div */
    $('#hc_container').bind('mousemove touchmove touchstart', function(e) {
      var chart, point, i, event;
      for (i = 0; i < Highcharts.charts.length; i++) {      /* loop through both charts */
          chart = Highcharts.charts[i];                     /* identify the chart */
          event = chart.pointer.normalize(e.originalEvent); /* find chart coordinates */
                             /* evaluate for synchronization, to address lateral charts */
          event.chartX = (event.chartX + $('[id$=Chart]').width()) % $('[id$=Chart]').width();
          point = chart.series[0].searchPoint(event, true); /* get closest point */
          if (point) {                                      /* if point found, tip it */
              point.highlight(e);                           /* trigger tooltip */
          }
      }  /* this code is to ensure the tooltips match */
      var gr = $('div.highcharts-label.highcharts-tooltip');/* collect visible tooltips */
      var gr0 = gr[0].firstChild.firstChild.textContent;    /* collect 1st x-axis tooltip text */
      var gr1 = gr[1].firstChild.firstChild.textContent;    /* collect 2nd x-axis tooltip text */
      if(gr0 !== gr1) {            /* the tips don't match due to data point proximity, fix it */
        var p = Highcharts.charts[1].series[0].points;      /* find all points in chart 1 */
        point = p.find(o => o.category === gr0);            /* get point matching chart 0 tip */
        if(point) {                                         /* if point found, tip it */
          point.highlight(e);                               /* trigger tooltip */
        }
      }
    });
  }, 500);
  Highcharts.Pointer.prototype.reset = function() {        /* reset tooltip */
    return null;
  };
  Highcharts.Point.prototype.highlight = function(event) { /* executes tooltip from trigger */
    event = this.series.chart.pointer.normalize(event);    /* capture that event occurred */
    this.onMouseOver();                                    /* show marker */
    this.series.chart.tooltip.refresh(this);               /* show tooltip */
    this.series.chart.xAxis[0].drawCrosshair(event, this); /* show crosshair */
  };
")),
div(id = "hc_container",     # this id is used in the JQuery/Javascript above
    div(hc1, style = 'height:100%; width: 50%; float:left;'), # first plot
    div(hc2, style = 'height:100%; width: 50%; float:left;'), # second plot
    style = "height:100%; width:100%; float:left;"))) # container styles
highcharter库实现并不太困难。如果您有兴趣使用该库,请告诉我。我可以添加一个答案,向您展示如何创建它。 - Kathighcharter的答案吗?来自巴西的问候。 - neves