在 Shiny 应用程序中,如何在 Plotly R 图表中实现悬停图像?

9

这里有没有人能提供一个示例,当鼠标悬停在绘图上时显示图片的方法或任何可以实现此功能的包?我已经尝试过一些方法,但它只会显示url而不是图片。我知道这段代码只是将URL嵌套起来。如何构建一个div来显示图片。

library(shiny)
library(shinydashboard)
library(DT)
library(dplyr)
library(plotly)

# Data ------------------------------------------------------------------
dt <- data.frame(fruits = c("apple","banana","oranges"),
  rank = c(11, 22, 33), 
  image_url = c(
    'https://images.unsplash.com/photo-1521671413015-ce2b0103c8c7?ixlib=rb-0.3.5&s=45547f67f01ffdcad0e33c8417b840a9&auto=format&fit=crop&w=667&q=80',             
    "https://images.unsplash.com/photo-1520699697851-3dc68aa3a474?ixlib=rb-0.3.5&ixid=eyJhcHBfaWQiOjEyMDd9&s=ef15aee8bcb3f5928e5b31347adb6173&auto=format&fit=crop&w=400&q=80",                        
    "https://images.unsplash.com/photo-1501925873391-c3cd73416c5b?ixlib=rb-0.3.5&ixid=eyJhcHBfaWQiOjEyMDd9&s=379e4a0fffc6d11cd5794806681d0211&auto=format&fit=crop&w=750&q=80"
))

# img_dt <- dt %>%
#   mutate(img = paste0("<a target='_blank' href='", image_url, "'><img src=\'", image_url, "' height='40'></img></a>")) %>%
#   mutate(link = paste0("<a href='", image_url,"' target='_blank'>","View photo","</a>")) 

# Dashboard ----------------------------------------------------------------
ui <- dashboardPage(
  dashboardHeader(title = "Test"),

  dashboardSidebar(),

  dashboardBody(
    tags$head(
      tags$style(
        HTML(
          "img.small-img {
          max-width: 75px;
          }")
      )
    ),

    plotlyOutput("hoverplot")
  )
)

server <- function(input, output) {

  output$hoverplot <- renderPlotly({
    plot_ly(
      dt,
      x         = ~fruits,
      y         = ~rank,
      type      = 'scatter',
      mode      = 'markers',
      hoverinfo = 'text',
      text      = ~ paste(
        'Species: ', fruits,
        '</br> Creative: ', paste0(
          "<a target='_blank' href='", image_url, "'><img src=\'",
          image_url,
          "' height='40'></img></a>"
          )
        )
      )
    })
}

shinyApp(ui = ui, server = server)
2
不可能实现:https://dev59.com/obbna4cB1Zd3GeqPWCOL。但是你可以通过这个链接实现:https://anchormen.nl/blog/data-science-ai/images-in-plotly-with-r/。 - Stéphane Laurent
1
只是为了明确,您想要在工具提示中放置图像吗?我能找到的最接近的示例允许您将图像放置在绘图的某个位置 - 即左上角。请参见:https://plotly-r.com/supplying-custom-data.html#fig:tooltip-image - bikeactuary
@SNT,非常感谢您对我下面的方法提出评论。 - ismirsehregal
1个回答

16

正如@StéphaneLaurent所述,使用plotly的hoverinfo不能直接显示图片是不可能的

然而,这里有一个基于@mb158127已经提到的customdata参数的解决方法。

这也考虑了hover_event的x和y位置:

library(shiny)
library(shinydashboard)
library(plotly)

# Data ------------------------------------------------------------------
dt <- data.frame(
  fruits = c("apple", "banana", "oranges"),
  rank = c(11, 22, 33),
  image_url = c(
    'https://images.unsplash.com/photo-1521671413015-ce2b0103c8c7?ixlib=rb-0.3.5&s=45547f67f01ffdcad0e33c8417b840a9&auto=format&fit=crop&w=667&q=80',
    "https://images.unsplash.com/photo-1520699697851-3dc68aa3a474?ixlib=rb-0.3.5&ixid=eyJhcHBfaWQiOjEyMDd9&s=ef15aee8bcb3f5928e5b31347adb6173&auto=format&fit=crop&w=400&q=80",
    "https://images.unsplash.com/photo-1501925873391-c3cd73416c5b?ixlib=rb-0.3.5&ixid=eyJhcHBfaWQiOjEyMDd9&s=379e4a0fffc6d11cd5794806681d0211&auto=format&fit=crop&w=750&q=80"
  )
)

# Dashboard ----------------------------------------------------------------
ui <- dashboardPage(
  dashboardHeader(title = "Test"),
  dashboardSidebar(),
  dashboardBody(tags$head(tags$style(
    HTML("img.small-img {
          max-width: 75px;
          }")
  )),
  plotlyOutput("hoverplot"))
)

server <- function(input, output, session) {
  output$hoverplot <- renderPlotly({
    plot_ly(
      dt,
      x         = ~ fruits,
      y         = ~ rank,
      type      = 'scatter',
      mode      = 'markers',
      hoverinfo = 'none',
      source = "hoverplotsource",
      customdata = ~ image_url
    ) %>%
      event_register('plotly_hover') %>%
      event_register('plotly_unhover')
  })

  hover_event <- reactive({
    event_data(event = "plotly_hover", source = "hoverplotsource")
  })

  unhover_event <- reactive({
    event_data(event = "plotly_unhover", source = "hoverplotsource")
  })

  hoverplotlyProxy <- plotlyProxy("hoverplot", session)

  observeEvent(unhover_event(), {
    hoverplotlyProxy %>%
      plotlyProxyInvoke("relayout", list(images = list(NULL)))
  })

  observeEvent(hover_event(), {
    hoverplotlyProxy %>%
      plotlyProxyInvoke("relayout", list(images = list(
        list(
          source = hover_event()$customdata,
          xref = "x",
          yref = "y",
          x = hover_event()$x,
          y = hover_event()$y,
          sizex = 20,
          sizey = 20,
          opacity = 1
        )
      )))
  })
}

shinyApp(ui = ui, server = server)

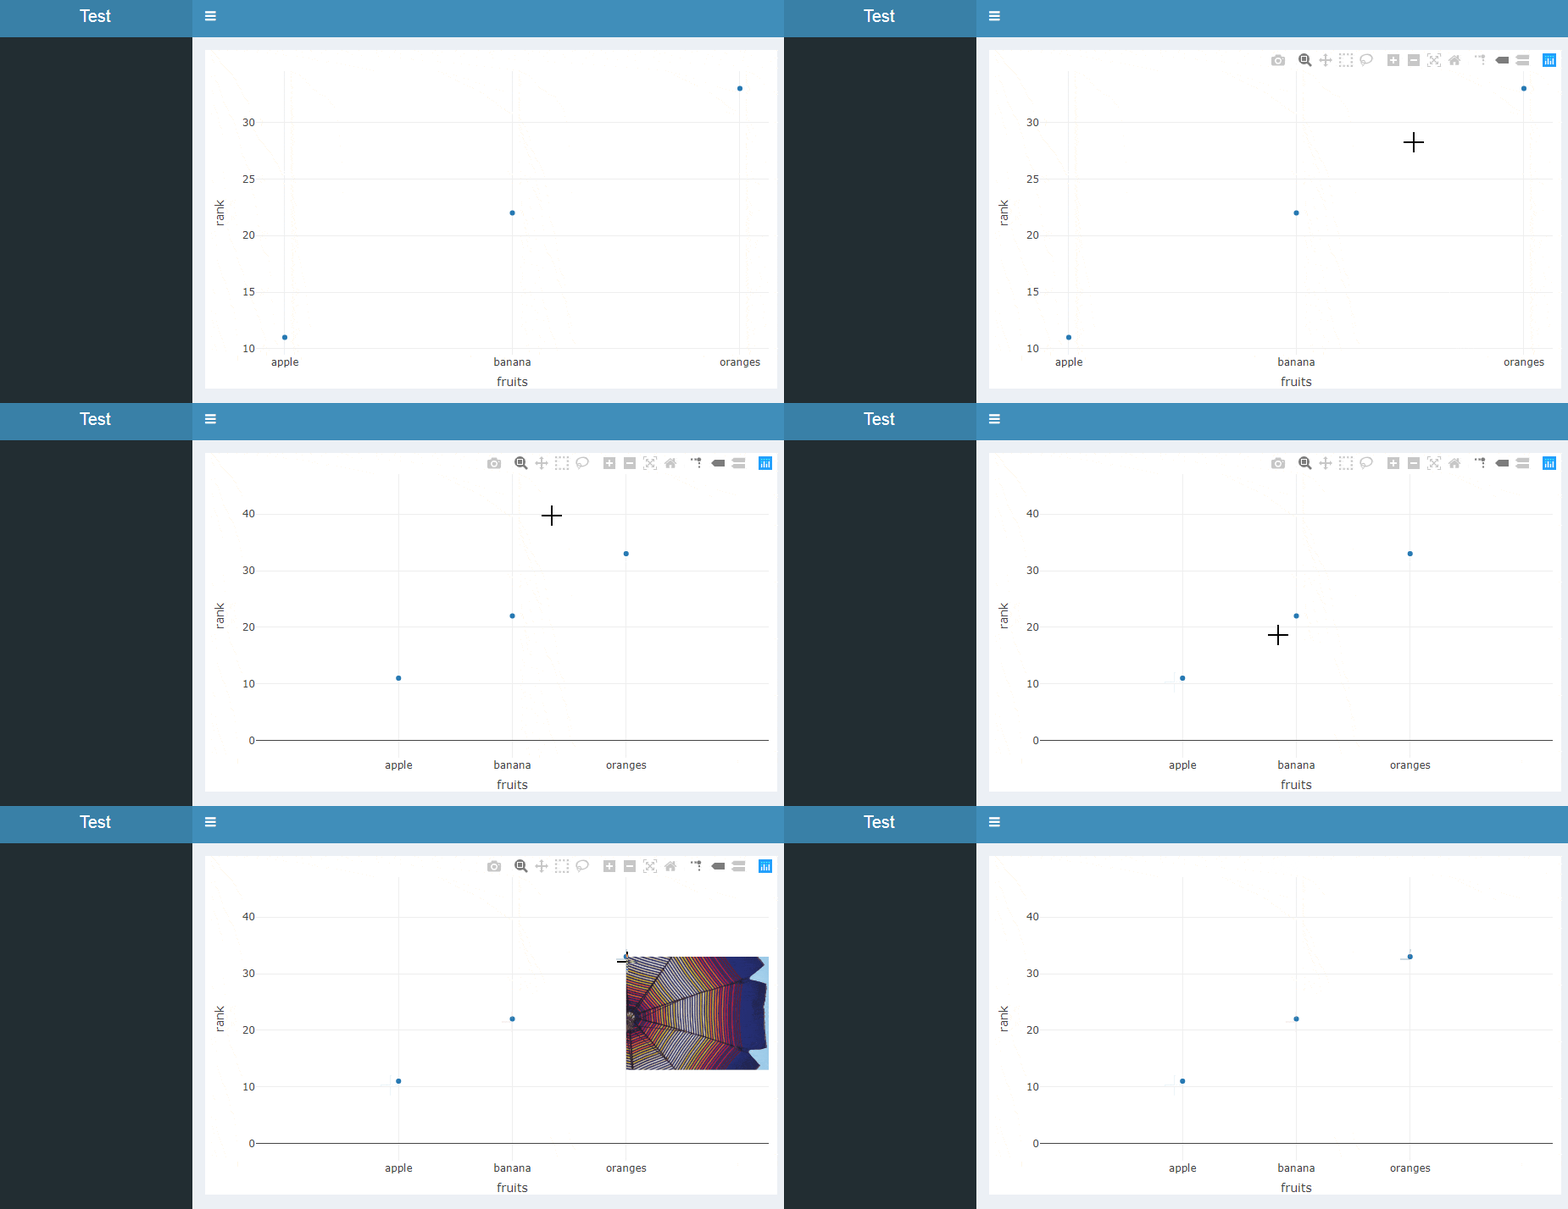
Result

这里您可以找到一个关于如何在这种情况下使用本地图像的后续问题。


网页内容由stack overflow 提供, 点击上面的
可以查看英文原文,
原文链接