如何确定SVG二次贝塞尔弧的顶点坐标?
4
- Ali
4
1我不确定我理解你的问题:你能添加一张图像来解释一下“弧线的顶点”是什么意思吗? - Mike 'Pomax' Kamermans
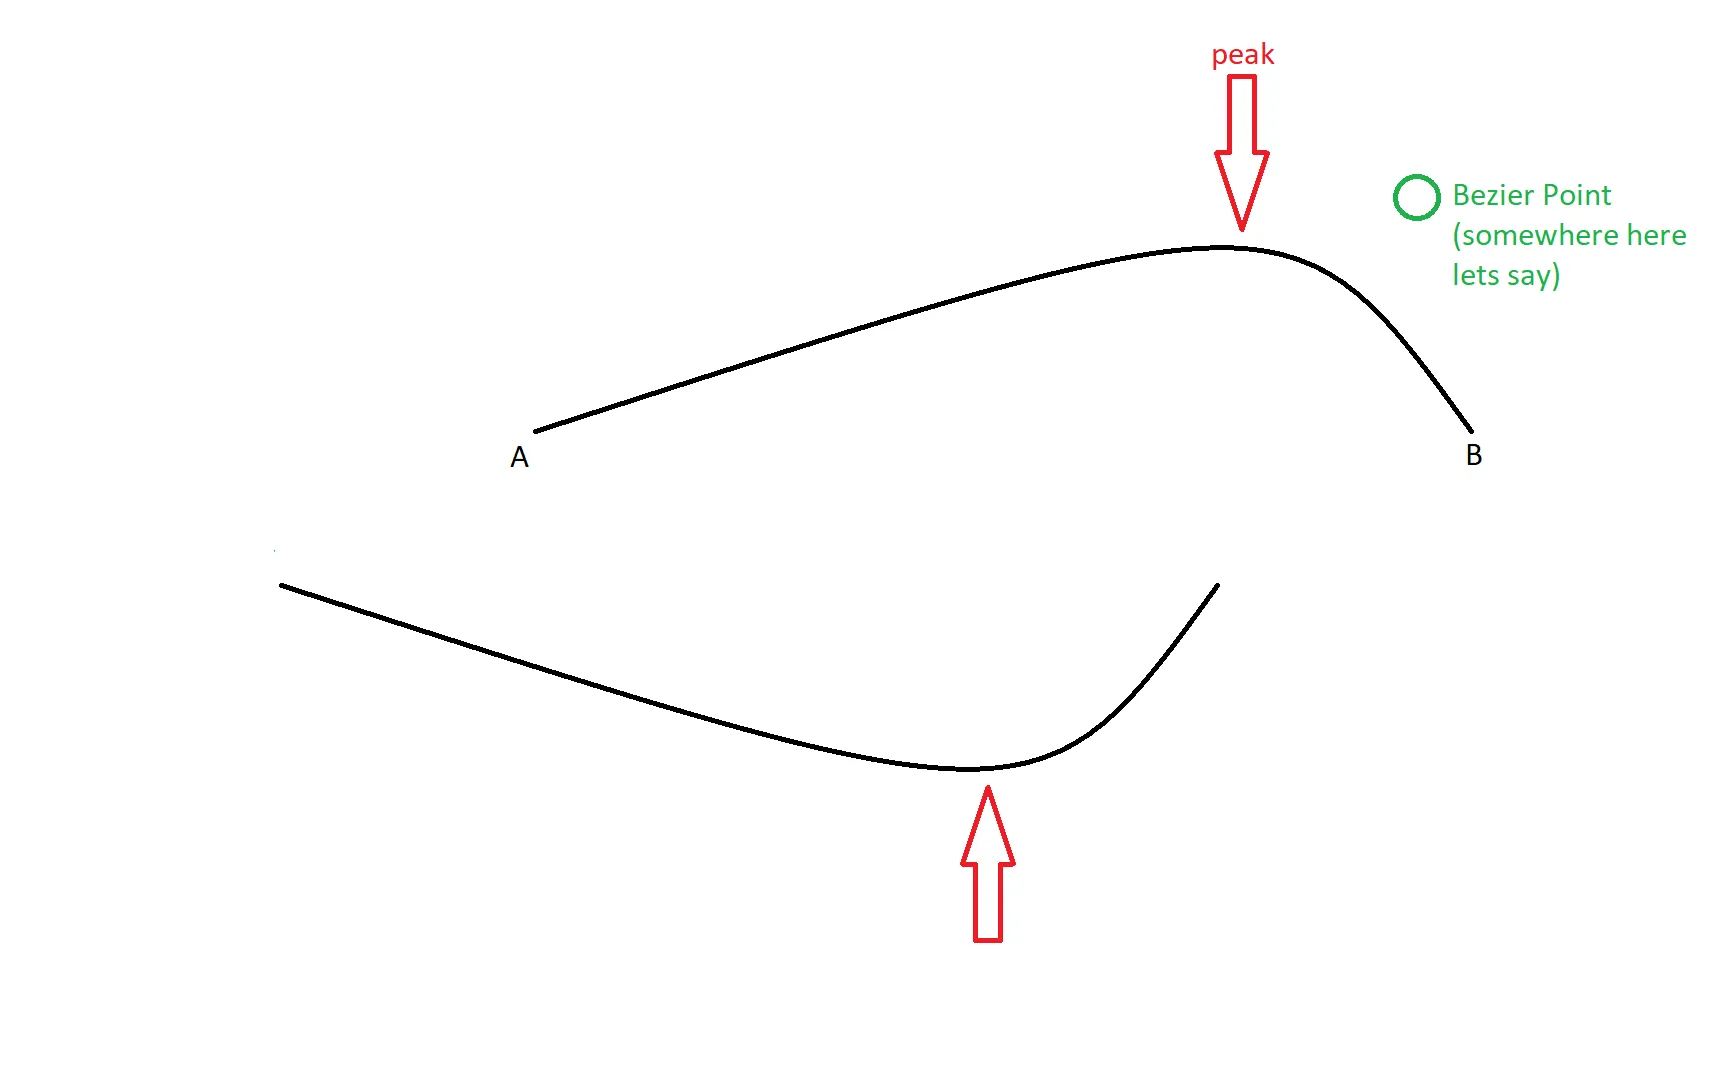
嗨,@Mike'Pomax'Kamermans,我已经添加了一张图片来更好地解释我的意思(请注意,峰值可以低或高,如图所示,但它是曲线改变方向的点)。 - Ali
我可能不应该使用“峰值”这个词,因为它并不一定具有最高的y值。但它是曲线改变方向的点。 - Ali
啊。将你的曲线与x轴对齐,然后找到y导数为零的点即可。 - Mike 'Pomax' Kamermans
2个回答
4
请注意,您要查找的不是曲线“变化”的位置,因为方向是数学中定义明确的概念,意味着我们沿曲线行进的方式。例如,Bezier 曲线
您要找的是与曲线“对齐”的坐标系中的 极值。不幸的是,并不存在单一的这样的坐标系,因此您必须选择一个,但我们可以选择一个看起来合理的坐标系:我们可以通过将曲线 重新调整 到 x 轴上,然后找到 y 导数为零的点来找到“该”点。由于 二次曲线的导数是一条直线,因此我们可以相当容易地找到这个
事实上,我们可以轻易地找到它,如果你仔细阅读代码,我们甚至不需要这段代码。极值将在t=0.5处出现,这是控制点对曲线影响最大、曲率半径最小的位置。我们可以直接计算我们需要的内容,跳过我们刚刚做的一切(但只有在确定我们不需要它时才能这样做!=)。
p1、p2、p3 和 p3、p2、p1 看起来相同,但方向相反。您要找的是与曲线“对齐”的坐标系中的 极值。不幸的是,并不存在单一的这样的坐标系,因此您必须选择一个,但我们可以选择一个看起来合理的坐标系:我们可以通过将曲线 重新调整 到 x 轴上,然后找到 y 导数为零的点来找到“该”点。由于 二次曲线的导数是一条直线,因此我们可以相当容易地找到这个
y 值。
const { cos, sin, atan2 } = Math;
function map(v, s1,e1, s2,e2) {
  return  s2 + (v-s1) * (e2-s2)/(e1-s1);
}

const path = original.getAttribute(`d`);
const terms = path.replace(/[A-Z]/g, ``).split(/\s+/).map(v => parseFloat(v));
const points = [];
for(let i=0, e=terms.length; i<e; i=i+2) points[i/2] = terms.slice(i,i+2);

// Let's do the thing, which we don't actually need to do because for
// quadratic curves it'll turn out we already know at which "t" value
// the axis-aligned extremum can be found. But let's discover that anyway:
(function findExtremum([p1, p2, p3]) {

  const [sx, sy] = p1;
  const [cx, cy] = p2;
  const [ex, ey] = p3;

  // In order to realign, we only need to recompute three points.
  // The other three are all zero.

  const a = atan2(ey-sy, ex-sx);
  const newcx = (cx-sx) * cos(-a) - (cy-sy) * sin(-a);
  const newcy = (cx-sx) * sin(-a) + (cy-sy) * cos(-a);
  const newex = (ex-sx) * cos(-a) - (ey-sy) * sin(-a);
  aligned.setAttribute(`d`, `M0 0 Q${newcx} ${newcy} ${newex} 0`);

  // If we work out the derivative, we discover we don't need it
  // thanks to our translation/rotation step:
  //
  //   const d = [
  //     [2 * (newcx - 0), 2 * (newcy - 0)],
  //     [2 * (newex - newcx), 2 * (0 - newcy)],
  //   ];
  //
  // Which, when we omit the zeroes, is:
  //
  //   const d = [
  //     [2 * newcx, 2 * newcy],
  //     [2 * (newex - newcx), 2 * -newcy],
  //   ];
  //
  // We see two y values that are the same, except for the sign,
  // and so the zero crossing lies at the midpoint, i.e. at the
  // bezier control value t=0.5, and with that knowledge we can
  // find the original point:

  const t = 0.5;

  // This is all we needed, and all the code we've written so far
  // turns out to have been irrelevant: for quadratic curves, the
  // axis-aligned extremum is *always* at t=0.5, so let's plug
  // that into our curves to see the result:

  const x = 2 * newcx * (1-t) * t + newex * t**2;
  const y = 2 * newcy * (1-t) * t;
  extremum.setAttribute(`cx`, x);
  extremum.setAttribute(`cy`, y);

  // and for our original curve:

  const ox = sx * (1-t)**2 + 2 * cx * (1-t) * t + ex * t**2;
  const oy = sy * (1-t)**2 + 2 * cy * (1-t) * t + ey * t**2;
  point.setAttribute(`cx`, ox);
  point.setAttribute(`cy`, oy);

})(points);
svg { border: 1px solid grey; }
p { display: inline-block; height: 120px; vertical-align: 40px; }<svg width="120" height="100" viewBox="0 0 120 100">
<path id="original" fill="none" stroke="black" d="M20 50 Q50 10 100 80"/>
</svg>
<p>→</p>
<svg width="120" height="100" viewBox="0 0 120 100">
<g transform="translate(20,80)">
<path fill="none" stroke="grey" d="M0 -100L0 200M-100 0L200 0"/>
<path id="aligned" fill="none" stroke="black" d=""/>
<circle id="extremum" cx="0" cy="0" r="2"/>
</g>
</svg>
<p>→</p>
<svg width="120" height="100" viewBox="0 0 120 100">
<path fill="none" stroke="black" d="M20 50 Q50 10 100 80"/>
<circle id="point" cx="0" cy="0" r="2"/>
</svg>const path = original.getAttribute(`d`);
const terms = path.replace(/[A-Z]/g, ``).split(/\s+/).map(v => parseFloat(v));
const points = [];
for(let i=0, e=terms.length; i<e; i=i+2) points[i/2] = terms.slice(i,i+2);
// If t=0.5 then (1-t)^2, (1-t)t, and t^2 are all 0.25, so
// we can drastically simplify things even more:
const x = (points[0][0] + 2*points[1][0] + points[2][0])/4;
const y = (points[0][1] + 2*points[1][1] + points[2][1])/4;
point.setAttribute(`cx`, x);
point.setAttribute(`cy`, y);svg { border: 1px solid grey; }
p { display: inline-block; height: 120px; vertical-align: 40px; }<svg width="120" height="100" viewBox="0 0 120 100">
<path id="original" fill="none" stroke="black" d="M20 50 Q50 10 100 80"/>
</svg>
<p>→</p>
<svg width="120" height="100" viewBox="0 0 120 100">
<path fill="none" stroke="black" d="M20 50 Q50 10 100 80"/>
<circle id="point" cx="0" cy="0" r="2"/>
</svg>完成。
- Mike 'Pomax' Kamermans
-1
暴力破解:
- 获取路径的总长度
- 检查路径上每个点的y值
对于一个SVG中的多条路径:
请注意粉色路径中的逻辑错误您需要修复
<peak-point>
  <svg>
    <path d="M20 50 Q50 10, 100 80"/>
    <path d="M 10 49 Q 13 111 74 97" fill="pink"/>
  </svg>
</peak-point>

<script>
  customElements.define('peak-point', class extends HTMLElement {
    connectedCallback() {
      setTimeout(() => { // make sure innerHTML SVG is parsed
        this.querySelectorAll("path").forEach(path => {
          const len = path.getTotalLength();
          let point;
          let pos = 0;
          let pointAt = (at) => (point = path.getPointAtLength(at));
          let previous_y = pointAt(0).y;
          while (previous_y >= pointAt(pos).y) {
            previous_y = point.y;
            pos++;
          }
          path.insertAdjacentHTML("afterend",
              `<circle cx="${point.x}" cy="${point.y}" r=5 fill="red"/>`);
        })
      })
    }
  });
</script>
- Danny '365CSI' Engelman
3
嗨@Danny..谢谢!我想我不应该使用“峰值”这个术语,因为它不一定具有最高的y值。我要找的点是曲线改变方向的地方。 - Ali
是的,你 需要添加一些额外的逻辑。 - Danny '365CSI' Engelman
1你可以这样做。或者,你可以使用一些非常简单的数学方法来找到实际点,如 https://pomax.github.io/bezierinfo/#tightbounds 上所解释的那样。 - Mike 'Pomax' Kamermans
网页内容由stack overflow 提供, 点击上面的可以查看英文原文,
原文链接
原文链接
