Matplotlib只有4种线型:['--', '-.', '-', ':']。是否可以在Matplotlib中使用多于4种不同类型的线型?
3个回答
14
使用
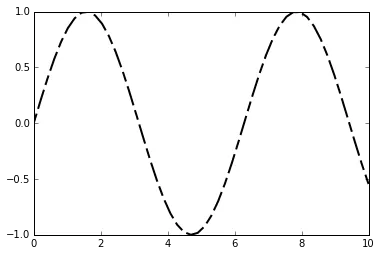
dashes参数可以创建更多类型的虚线样式。例如:import numpy as np
import matplotlib.pyplot as plt
x = np.linspace(0, 10)
y = np.sin(x)
plt.plot(x, y, dashes=[10, 5, 20, 5], linewidth=2, color='black')
- jakevdp
9
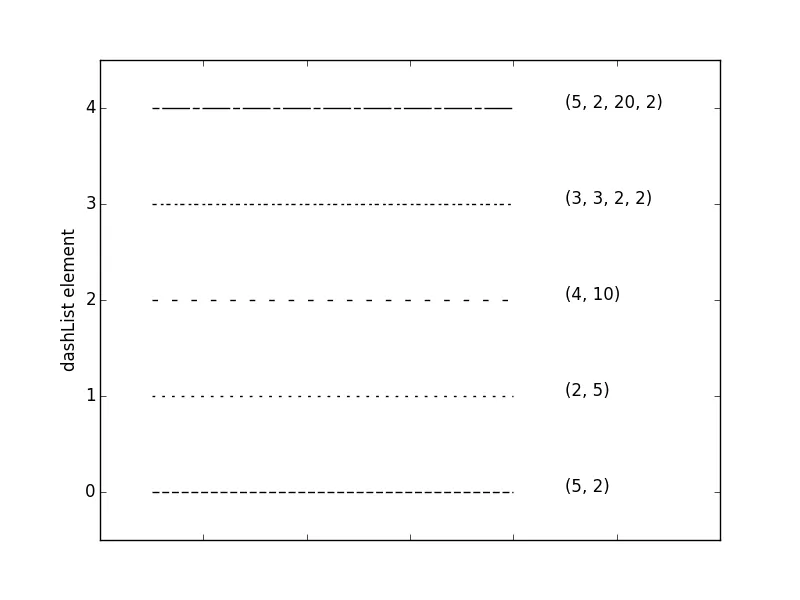
这里有另一个例子,您可以使用它来尝试不同的自定义线条样式(定义为列表“dashList”中的元素),并进行调整,以便在绘图中使用多个不同的自定义线条样式:
import matplotlib.pyplot as plt

dashList = [(5,2),(2,5),(4,10),(3,3,2,2),(5,2,20,2)]
# List of Dash styles, each as integers in the format: (first line length, first space length, second line length, second space length...)

# set up the axes to look nice:
frame1 = plt.gca()
frame1.axes.xaxis.set_ticklabels([]) # hide x axis numbers
plt.xlim(0,6) # set x and y axis extents
plt.ylim(-0.5,len(dashList)-0.5)
plt.ylabel("dashList element") # add a label to the y axis

for n in range(0,len(dashList)):
    plt.plot([0.5,4],[n,n], color = 'black', linestyle='--', dashes=dashList[n]) # plot a horizontal line using each custom line style
    # NB plot.plt draws a line between the following points: ([x0,x1],[y0,y1])
    plt.text(4.5,n,dashList[n]) # ...and show the numbers used to generate each custom linestyle
plt.show()
- DaveW
8
最新的 matplotlib 文档(目前未发布)现在包含许多自定义线型示例。以下是屏幕截图:
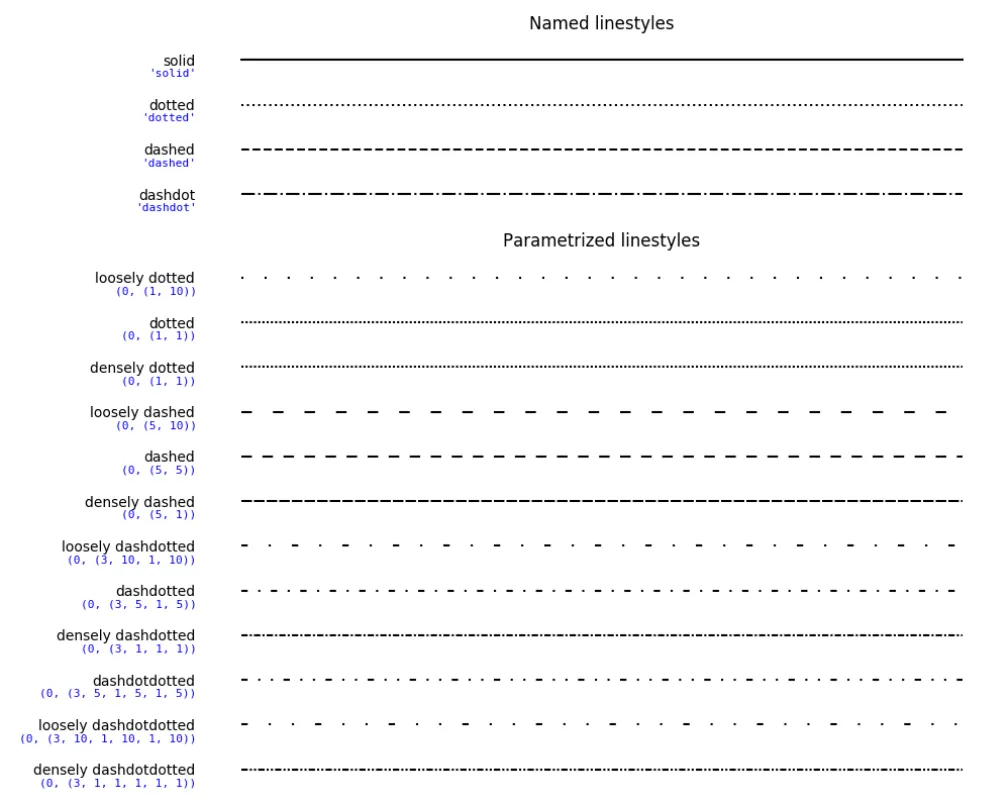
为了更轻松地复制粘贴,这是用于生成该图的代码的一部分:
linestyle_tuple = [
     ('loosely dotted',        (0, (1, 10))),
     ('dotted',                (0, (1, 1))),
     ('densely dotted',        (0, (1, 1))),

     ('loosely dashed',        (0, (5, 10))),
     ('dashed',                (0, (5, 5))),
     ('densely dashed',        (0, (5, 1))),

     ('loosely dashdotted',    (0, (3, 10, 1, 10))),
     ('dashdotted',            (0, (3, 5, 1, 5))),
     ('densely dashdotted',    (0, (3, 1, 1, 1))),

     ('dashdotdotted',         (0, (3, 5, 1, 5, 1, 5))),
     ('loosely dashdotdotted', (0, (3, 10, 1, 10, 1, 10))),
     ('densely dashdotdotted', (0, (3, 1, 1, 1, 1, 1)))]
- James Wright
网页内容由stack overflow 提供, 点击上面的可以查看英文原文,
原文链接
原文链接