我用matplotlib画了一个条形图,如下所示:
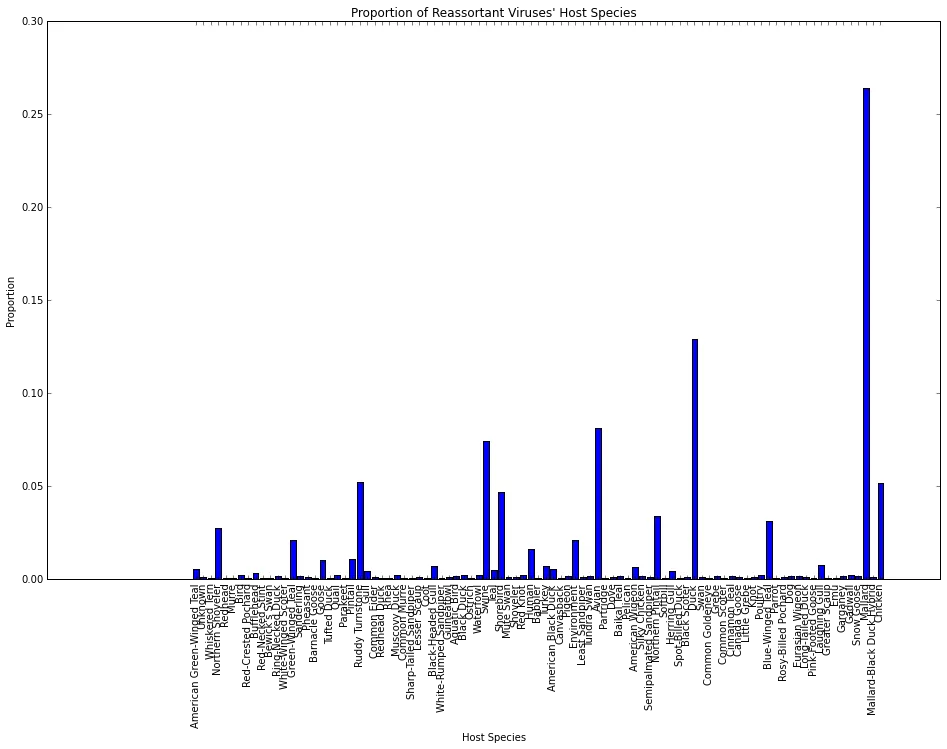
我的x轴刻度没有覆盖整个x轴范围。我该怎么做才能实现这一点?
我的代码在这里:
def counter_proportions(counter):
    total = sum(counter.values())

    proportions = dict()
    for key, value in counter.items():
        proportions[key] = float(value)/float(total)

    return proportions

def categorical_counter_xlabels(counter):
    idxs = dict()

    for i, key in enumerate(counter.keys()):
        idxs[key] = i

    return idxs

# Use this dummy data
detailed_hosts = ['Species1' * 3, 'Species2' * 1000, 'Species3' * 20, 'Species4' * 20]
# Create a detailed version of the counter, which includes the exact species represented.
detailed_hosts = []

counts = Counter(detailed_hosts)
props = counter_proportions(counts)
xpos = categorical_counter_xlabels(counts)

fig = plt.figure(figsize=(16,10))
ax = fig.add_subplot(111)
plt.bar(xpos.values(), props.values(), align='center')
plt.xticks(xpos.values(), xpos.keys(), rotation=90)
plt.xlabel('Host Species')
plt.ylabel('Proportion')
plt.title("Proportion of Reassortant Viruses' Host Species")
plt.savefig('Proportion of Reassortant Viruses Host Species.pdf', bbox_inches='tight')
matplotlibAPI,如何确保居中对齐的条形图填满x轴?我在API文档中没有找到答案,所以想在这里问一下。 - ericmjlplt.axis('tight')或plt.margins(0.05, 0)。如果需要更多控制,你可以根据数据手动设置坐标轴的 x 轴限制(例如plt.xlim(x.min() - width, x.max() + width))。 - Joe Kington