如何配置Angular和VSCode,使我的断点正常工作?
11个回答
204
已在 Angular 5 / CLI 1.5.5 上测试通过
- 安装 Chrome Debugger 扩展
- 创建
launch.json(位于 .vscode 文件夹内) - 使用我的
launch.json(见下文) - 创建
tasks.json(位于 .vscode 文件夹内) - 使用我的
tasks.json(见下文) - 按CTRL+SHIFT+B
- 按F5
angular/cli >= 1.3 的 launch.json
{
  "version": "0.2.0",
  "configurations": [
    {
      "name": "Launch Chrome",
      "type": "chrome",
      "request": "launch",
      "url": "http://localhost:4200/#",
      "webRoot": "${workspaceFolder}"
    },
    {
      "name": "Attach Chrome",
      "type": "chrome",
      "request": "attach",
      "url": "http://localhost:4200/#",
      "webRoot": "${workspaceFolder}"
    },
    {
      "name": "Launch Chrome (Test)",
      "type": "chrome",
      "request": "launch",
      "url": "http://localhost:9876/debug.html",
      "webRoot": "${workspaceFolder}"
    },
    {
      "name": "Launch Chrome (E2E)",
      "type": "node",
      "request": "launch",
      "program": "${workspaceFolder}/node_modules/protractor/bin/protractor",
      "protocol": "inspector",
      "args": ["${workspaceFolder}/protractor.conf.js"]
    }
  ]
}
angular/cli >= 1.3 的 tasks.json
{
    "version": "2.0.0",
    "tasks": [
      {
        "identifier": "ng serve",
        "type": "npm",
        "script": "start",
        "problemMatcher": [],
        "group": {
          "kind": "build",
          "isDefault": true
        }
      },
      {
        "identifier": "ng test",
        "type": "npm",
        "script": "test",
        "problemMatcher": [],
        "group": {
          "kind": "test",
          "isDefault": true
        }
      }
    ]
  }
已测试使用Angular 2.4.8
- 安装Chrome调试器扩展程序
- 创建
launch.json文件 - 使用我的
launch.json(见下文) - 启动NG开发服务器(
ng serve) - 按下F5
angular/cli >= 1.0.0-beta.32的launch.json配置
{
  "version": "0.2.0",
  "configurations": [
    {
      "type": "chrome",
      "request": "launch",
      "name": "Launch Chrome",
      "url": "http://localhost:4200",
      "webRoot": "${workspaceFolder}",
      "sourceMaps": true,
      "userDataDir": "${workspaceFolder}/.vscode/chrome",
      "runtimeArgs": [
        "--disable-session-crashed-bubble"
      ]
    },
    {
      "name": "Attach Chrome",
      "type": "chrome",
      "request": "attach",
      "url": "http://localhost:4200",
      "port": 9222,
      "webRoot": "${workspaceFolder}",
      "sourceMaps": true
    }
  ]
}
angular/cli < 1.0.0-beta.32 的 launch.json
{
  "version": "0.2.0",
  "configurations": [
    {
      "name": "Lunch Chrome",
      "type": "chrome",
      "request": "launch",
      "url": "http://localhost:4200",
      "webRoot": "${workspaceFolder}/src/app",
      "sourceMaps": true,
      "sourceMapPathOverrides": {
        "webpack:///./~/*": "${workspaceFolder}/node_modules/*",
        "webpack:///./src/*": "${workspaceFolder}/src/*"
      },
      "userDataDir": "${workspaceFolder}/.vscode/chrome",
      "runtimeArgs": [
        "--disable-session-crashed-bubble"
      ]
    },
    {
      "name": "Attach Chrome",
      "type": "chrome",
      "request": "attach",
      "url": "http://localhost:4200",
      "port": 9222,
      "webRoot": "${workspaceFolder}/src/app",
      "sourceMaps": true,
      "sourceMapPathOverrides": {
        "webpack:///./~/*": "${workspaceFolder}/node_modules/*",
        "webpack:///./src/*": "${workspaceFolder}/src/*"
      }
    }
  ]
}
- Asesjix
13
9你知道如何在仅需按下一次
F5 键就能启动 NG Live Development Server 并打开 Chrome 吗? - Merdan Gochmuradov2很抱歉,这是不可能的,因为任务“ng serve”必须在preLaunchTask中启动。
“ng serve”必须一直运行,因此“preLaunchTask”未完成,这意味着vs code无法启动调试过程。但是我已经添加了一个新的配置,应该可以使工作更快一些;-) - Asesjix
2简短明了的回答。如果您能简要解释一下
launch.json 和 tasks.json 在这里的作用就更好了。据我所知,launch.json 用于启动节点服务器并监听端口8080,而 tasks.json 则指示使用 npm 并执行命令 ng serve 来运行应用程序。 - Shaiju T3我遇到了相同的问题,断点无法设置,直到我意识到我的网站根目录是错误的。我使用了webRoot的默认值("webRoot": "${workspaceFolder}"),而不是${workspaceFolder}/my-app-folder。 - Joseph Simpson
6Chrome调试器扩展现已被弃用。 - Liam
显示剩余8条评论
61
看起来 Visual Studio Code 团队现在正在存储调试配方。
https://github.com/Microsoft/vscode-recipes/tree/master/Angular-CLI
{
  "version": "0.2.0",
  "configurations": [
    {
      "name": "Launch Chrome with ng serve",
      "type": "chrome",
      "request": "launch",
      "url": "http://localhost:4200",
      "webRoot": "${workspaceRoot}"
    },
    {
      "name": "Launch Chrome with ng test",
      "type": "chrome",
      "request": "launch",
      "url": "http://localhost:9876/debug.html",
      "webRoot": "${workspaceRoot}"
    },
    {
      "name": "Launch ng e2e",
      "type": "node",
      "request": "launch",
      "program": "${workspaceRoot}/node_modules/protractor/bin/protractor",
      "protocol": "inspector",
      "args": ["${workspaceRoot}/protractor.conf.js"]
    }
  ]
}
- Levi Fuller
16
有两种不同的方法来做到这一点。您可以启动一个新进程或附加到一个现有进程。
这两个过程的关键是同时运行 webpack dev server 和 VSCode 调试器。
启动一个进程
在您的
launch.json文件中添加以下配置:
{
  "version": "0.2.0",
  "configurations": [
    {
      "name": "Angular debugging session",
      "type": "chrome",
      "request": "launch",
      "url": "http://localhost:4200",
      "webRoot": "${workspaceFolder}"
    }
  ]
}
通过执行npm start命令从Angular CLI中运行Webpack开发服务器。
连接到现有进程
为此,您需要以调试器模式运行Chrome,并打开端口(在我的情况下是
9222):Mac:
/Applications/Google\ Chrome.app/Contents/MacOS/Google\ Chrome --remote-debugging-port=9222Windows:
chrome.exe --remote-debugging-port=9222launch.json文件将以以下方式显示:- 通过执行
npm start命令在 Angular CLI 中运行 Webpack dev server。 - 选择“Chrome Attach”配置并运行它。
{
  "version": "0.2.0",
  "configurations": [
    {
      "name": "Chrome Attach",
      "type": "chrome",
      "request": "attach",
      "port": 9222,
      "url": "http://localhost:4200/",
      "webRoot": "${workspaceFolder}"
    }
  ]
}
在这种情况下,调试器会附加到现有的 Chrome 进程,而不是启动一个新窗口。
我写了一篇文章,其中描述了这种方法,并配以插图。
- skryvets
5
谢谢,每次启动 Chrome 我都需要运行这个命令
chrome.exe --remote-debugging-port=9222。有没有一种替代方法来进行一次性配置呢? - Saurabh Gangamwar根据您的凭据,您可以右键单击Windows开始菜单中的Chrome,点击属性,然后在那里添加标志。但这在我的工作电脑上不起作用,所以我在Git Bash for Windows中为该命令创建了别名。 - vitale232
@Saurabh47g,您可以将 chrome.exe --remote-debugging-port=9222 添加到桌面上的 Chrome 图标中。
步骤:
- 打开您的桌面
- 右键单击 Google Chrome
- 点击属性
- 在目标字段中粘贴 chrome.exe --remote-debugging-port=9222
对我来说,在这之后仍然没有起作用,我必须指定客户端运行的子目录。这是一个显而易见的检查事项,但这就是我所需要的:
"webRoot": "${workspaceFolder}/client"。 - M H对我来说,在这之后仍然无法工作,我必须指定客户端运行的子目录。这是一个显而易见的检查项,但这是我所需要的内容:
"webRoot": "${workspaceFolder}/client", - undefined9
这在Visual Studio Code网站上有详细的解释:https://code.visualstudio.com/docs/nodejs/angular-tutorial
- Victor Ionescu
2
1你是不是想说 https://code.visualstudio.com/docs/nodejs/angular-tutorial#_debugging-angular?·#_debugging-angular 直接指向了有趣的点,如果你想编辑你的答案... - Pipo
@Pipo 不好意思,我没有指的是nodejs,因为我没有在服务器端使用过nodejs,所以不太清楚。 - Victor Ionescu
8
可以使用这个配置:
{
 "version": "0.2.0",
"configurations": [
{
        "name": "ng serve",
        "type": "chrome",
        "request": "launch",
        "preLaunchTask": "npm: start",
        "url": "http://localhost:8080",
        "webRoot": "${workspaceFolder}"
      }
]
}
- Ahmad Aghazadeh
7
@Asesjix的答案非常详细,但是正如一些人指出的那样,仍然需要多次交互才能启动
ng serve,然后在Chrome中启动Angular应用程序。我使用以下配置实现了单击即可工作。与@Asesjix的答案的主要区别在于任务类型现在为shell,命令调用添加了start在ng serve之前,因此ng serve可以存在于自己的进程中,而不会阻止调试器启动:
tasks.json:
{
    "version": "2.0.0",
    "tasks": [
      {
        "label": "ng serve",
        "type": "shell",
        "command": "\"start ng serve\""
      },
      {
        "label": "ng test",
        "type": "shell",
        "command": "\"start ng test\"",
      }
    ]
  }
launch.json:
{
    "version": "0.2.0",
    "configurations": [
        {
            "name": "Launch in Chrome",
            "type": "chrome",
            "request": "launch",
            "url": "http://localhost:4200",
            "webRoot": "${workspaceFolder}",
            "preLaunchTask": "ng serve"
        }
    ]
}
- ubiquibacon
5
1这个在运行ng serve时卡在了shell中,没有启动chrome。 - Manuel
start ng serve 不是一个有效的命令。 - Stephen Pham
start 是一个 Windows CMD 命令。ng serve 是一个 Angular 命令。如果你在使用 Windows CMD 时收到 start my serve 不是有效命令的消息,我猜测你的路径中没有正确安装 Angular。 - ubiquibaconubiquibacon:嗯...我按照你上面的步骤操作了,但是弹出了一个名为
ng.ps1的文件。我能够在一个带有Angular项目的文件夹中运行ng serve,但是如果我使用start ng serve,会弹出一个类似的文件ng.ps1。 - Stephen Pham1抱歉,我已经放弃了Angular,转而使用Flutter,所以我觉得我在这里帮不上忙。我已经清除了与Angular相关的所有内容,包括记忆和硬盘中的文件。 - ubiquibacon
4
如何在单个配置中为您的Angular应用提供服务并附加调试器
launch.json文件中的compound选项允许您创建一个可以同时启动多个启动配置的单个启动配置。如果您想要例如启动您的Web服务器并附加调试器(为什么不同时启动后端),或者如果您有任何其他特定需求,这将非常有用。
您可以像这样使用它:
{
    "version": "0.2.0",
    "configurations": [
        {
            "name": "Angular Debug",
            "type": "chrome",
            "request": "launch",
            "url": "http://localhost:4200",
            "webRoot": "${workspaceFolder}",
            "sourceMaps": true,
            "sourceMapPathOverrides": {
                "webpack:///./*": "${webRoot}/*"
            },
        },
        {
            "name": "Angular Serve",
            "command": "ng serve --open",
            "request": "launch",
            "type": "node-terminal",
            "cwd": "${workspaceFolder}",
        },
    ],
    "compounds": [
        {
          "name": "Angular Launch",
          "configurations": ["Angular Serve", "Angular Debug"]
        }
      ]
}
现在你有一个可以通过在VSCode中按下F5键启动的工作调试器。
- Allenile
2
这里有一个更轻量级的解决方案,适用于Angular 2+(我使用的是Angular 4)
如果您运行的是MEAN堆栈,还添加了Express服务器的设置。
{
  // Use IntelliSense to learn about possible Node.js debug attributes.
  // Hover to view descriptions of existing attributes.
  // For more information, visit: https://go.microsoft.com/fwlink/?linkid=830387
  "version": "0.2.0",
  "configurations": [
    {
      "name": "Launch Angular Client",
      "type": "chrome",
      "request": "launch",
      "url": "http://localhost:4200",
      "runtimeArgs": [
        "--user-data-dir",
        "--remote-debugging-port=9222"
        ],
        "sourceMaps": true,
        "trace": true,
        "webRoot": "${workspaceRoot}/client/",
        "userDataDir": "${workspaceRoot}/.vscode/chrome"
    },
    {
      "type": "node",
      "request": "launch",
      "name": "Launch Express Server",
      "program": "${workspaceRoot}/server/bin/www",
      "outFiles": [
        "${workspaceRoot}/out/**/*.js"
      ]
    }
  ]
}
- Isak La Fleur
2
你能使用这个配置同时调试/设置断点你的服务器端代码和Angular吗? - Mika571
@Mika571 不好意思...我刚试了一下,不行。我也想同时调试服务器和客户端。 - Leniel Maccaferri
1
在我的情况下,我没有使用原始的Angular项目文件夹树,我知道
默认情况下没有 Tasks.json。按 Ctrl+Shift+p,然后我认为它被称为“为其他命令创建任务”或类似的东西。在创建 tasks.json 后似乎看不到它。您也可以在与 launch.json 相同的位置创建该文件。
webRoot/{workspaceFolder}这一部分出了问题,但是所有的尝试都没有结果。从另一个SO答案中得到了一个提示,如果我再找到它的话,我会提供链接。
对我有帮助的是,在运行时找到变量{workspaceFolder}的内容,然后将其修改为我的“src”文件夹的位置,在该文件夹下有“app/*”。为了找到它,我在我的launch.json文件中添加了一个preLaunchTask和一个任务来输出{workspaceFolder}的值。
launch.json是在安装Chrome调试器之后出现的。
{
  "version": "0.2.0",
  "configurations": [
    {
      "type": "chrome",
      "request": "launch",
      "name": "Launch Chrome against localhost",
      "url": "http://localhost:4200",
      "webRoot": "${workspaceFolder}/src/newProjectRoot/",
      "preLaunchTask": "Echo values" //Just to see what the cryptic vs code variables actually are https://code.visualstudio.com/docs/editor/variables-reference
    }
  ]
}
默认情况下没有 Tasks.json。按 Ctrl+Shift+p,然后我认为它被称为“为其他命令创建任务”或类似的东西。在创建 tasks.json 后似乎看不到它。您也可以在与 launch.json 相同的位置创建该文件。
{
  "version": "2.0.0",
  "tasks": [
    {
      "label": "Echo values",
      "command": "echo",
      "args": ["${env:USERNAME}", "workspaceFolder = ${workspaceFolder}"],
      "type": "shell"
    }
  ]
}
一旦我了解了${workspaceFolder}的价值,我就将其修复为指向我的新项目树中的src文件夹,然后一切都正常工作了。调试需要在预启动任务或构建(如上例)中作为一部分运行ng serve或在命令提示符中运行。
这里是所有可以使用的变量链接:
- Ash
0
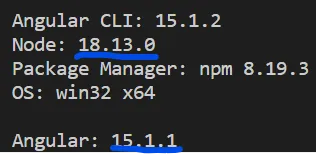
对于那些已经阅读了以上内容但仍无法正常工作的人,请通过ng version(在您的项目文件夹中)检查您的Angular和Node.js版本。
它应该输出版本:
- Sergey Skrynnik
网页内容由stack overflow 提供, 点击上面的可以查看英文原文,
原文链接
原文链接
- 相关问题
- 8 如何在VSCode中使用Edge浏览器调试Angular应用程序?
- 7 如何使用VSCode调试Lua Love2D?
- 21 如何使用VSCode调试gulp任务
- 6 如何使用VSCode调试JupyterDash应用程序?
- 8 如何使用VSCode调试CLI?
- 3 如何使用Visual Studio Code + VSCode Remote + Chrome调试器调试Angular应用程序
- 3 如何仅使用VSCode调试React Native?
- 4 如何使用Edge浏览器在VSCode中调试Angular应用程序?-后续
- 23 使用VSCode调试Celery
- 6 如何使用VSCode远程调试Go代码
ng serve,请参见此处的答案:链接 - minus one