访问稀疏矩阵元素

9
我有一个非常大的稀疏矩阵,类型为'scipy.sparse.coo.coo_matrix'。 我可以使用.tocsr()将其转换为csr格式,但是由于数组太大,.todense()将不起作用。 我想能够像处理常规数组一样提取矩阵中的元素,以便我可以将行元素传递给函数。
供参考,当打印时,矩阵如下所示:
(7, 0)  0.531519363001
(48, 24)    0.400946334437
(70, 6) 0.684460955022
...

2
csr 格式与密集数组一样支持索引(虽然速度不够快)。 coo 格式则不支持。对于整行,您可能希望执行 M1 = M.tocsr(); row = M1[i,:].A (toarray()),假设该函数需要一个密集数组。 - hpaulj
你怎么样才能提取出我打印的顶部的三个数字 ((7, 0) 0.531519363001)?我不知道你的示例中的 .A 是什么意思,但如果我跳过那部分,我会得到一长串 [0 0 0 ... 0]。 - Helicity
2个回答

13

创建一个有3个元素的矩阵:

In [550]: M = sparse.coo_matrix(([.5,.4,.6],([0,1,2],[0,5,3])), shape=(5,7))

默认显示方式 (repr(M)):

In [551]: M
Out[551]: 
<5x7 sparse matrix of type '<class 'numpy.float64'>'
    with 3 stored elements in COOrdinate format>

然后打印显示(str(M))- 看起来像输入:


In [552]: print(M)
  (0, 0)    0.5
  (1, 5)    0.4
  (2, 3)    0.6

转换为 csr 格式:

In [553]: Mc=M.tocsr()
In [554]: Mc[1,:]   # row 1 is another matrix (1 row):
Out[554]: 
<1x7 sparse matrix of type '<class 'numpy.float64'>'
    with 1 stored elements in Compressed Sparse Row format>

In [555]: Mc[1,:].A    # that row as 2d array
Out[555]: array([[ 0. ,  0. ,  0. ,  0. ,  0. ,  0.4,  0. ]])

In [556]: print(Mc[1,:])    # like 2nd element of M except for row number
  (0, 5)    0.4

单个元素:

In [560]: Mc[1,5]
Out[560]: 0.40000000000000002

这种格式的数据属性(如果你想深入了解)。
In [562]: Mc.data
Out[562]: array([ 0.5,  0.4,  0.6])
In [563]: Mc.indices
Out[563]: array([0, 5, 3], dtype=int32)
In [564]: Mc.indptr
Out[564]: array([0, 1, 2, 3, 3, 3], dtype=int32)
In [565]: M.data
Out[565]: array([ 0.5,  0.4,  0.6])
In [566]: M.col
Out[566]: array([0, 5, 3], dtype=int32)
In [567]: M.row
Out[567]: array([0, 1, 2], dtype=int32)

1
我该如何提取与我从 Mc[1,5] 获取的单个元素相关联的两个数字(如果我没记错的话,这种情况下是(0,5))? - Helicity
我认为 rdist.row[i],rdist.col[i] 可以得到我想要的数字。 - Helicity

0
我们可以将scipy.sparse.coo_array转换为pandas.DataFrame
实用函数:
from scipy.sparse import coo_array
import pandas as pd


def coo_to_dataframe(array: coo_array) -> pd.DataFrame:
    """Convert scipy COO sparse array to a pandas data frame."""
    labels = array.data
    columns = array.col
    rows = array.row

    data_frame = pd.DataFrame({"x": columns, "y": rows, "label": labels})

    return data_frame

创建一个稀疏数组(借用自@hpaulj):
sparse_array = coo_array(([.5, .4, .6], ([0 , 1, 2], [0, 5, 3])), shape=(5, 7))

对于一个小的示例数组,我们可以将其视为密集数组:

sparse_array.toarray()

array([[0.5, 0. , 0. , 0. , 0. , 0. , 0. ],
       [0. , 0. , 0. , 0. , 0. , 0.4, 0. ],
       [0. , 0. , 0. , 0.6, 0. , 0. , 0. ],
       [0. , 0. , 0. , 0. , 0. , 0. , 0. ],
       [0. , 0. , 0. , 0. , 0. , 0. , 0. ]])

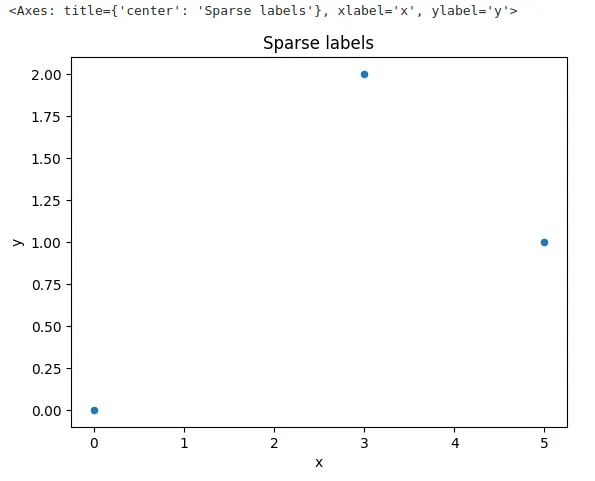
最后,我们将稀疏数组转换为DataFrame并绘制出来。
dataframe = coo_to_dataframe(sparse_array)

dataframe.plot.scatter("x", "y", title="Sparse labels")

Sparse labels plot


网页内容由stack overflow 提供, 点击上面的
可以查看英文原文,
原文链接