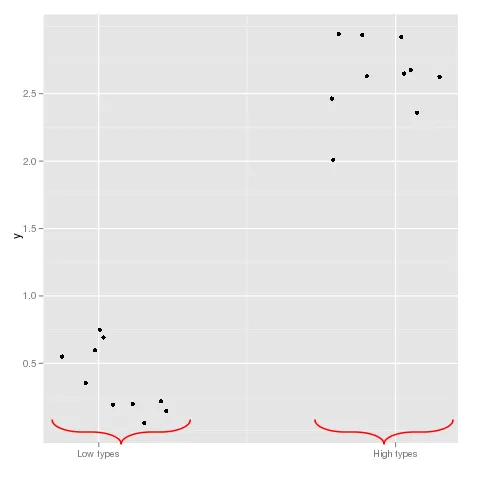
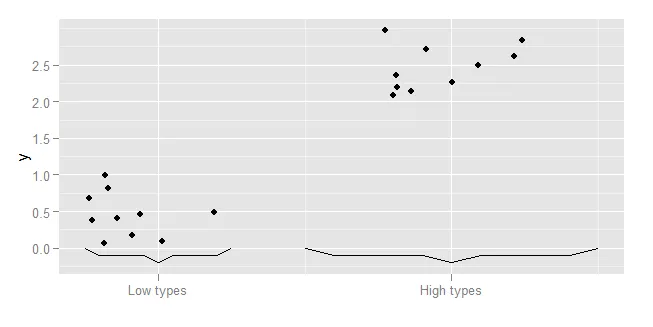
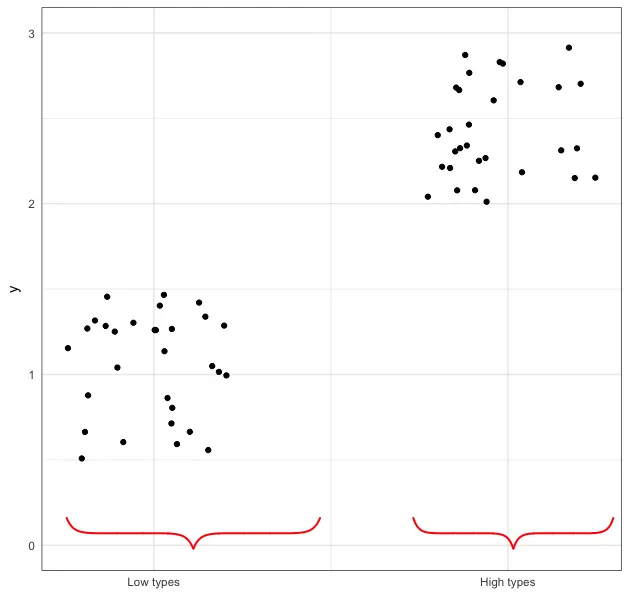
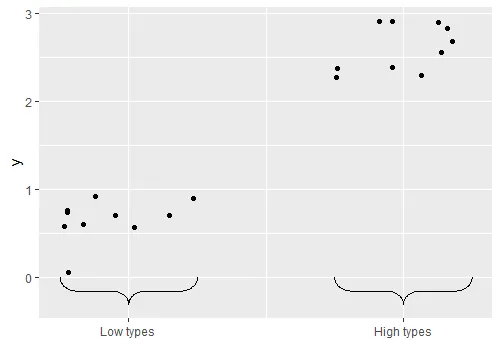
在回答最近的可视化问题中,我真的需要括号来显示坐标轴上的一个跨度,但我不知道如何在ggplot2中实现。这是图表:
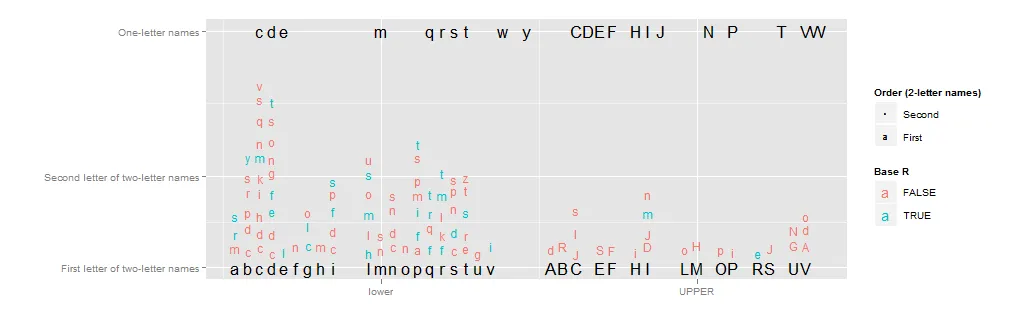
我希望y轴标签 "Second letter of two-letter names" 能够有一个大括号,延伸从1到10(红色和蓝色的第二个字母的垂直跨度),而不是勾号。但我不确定如何实现。x轴也可以采用类似的方法。
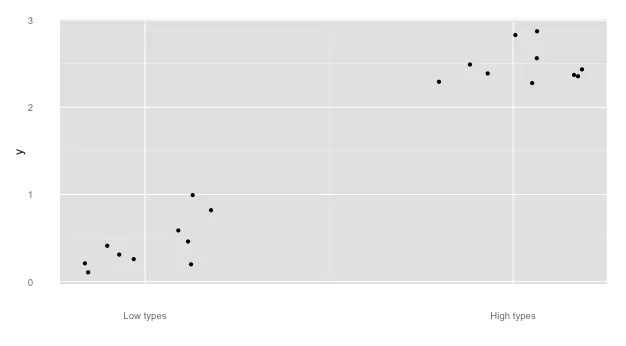
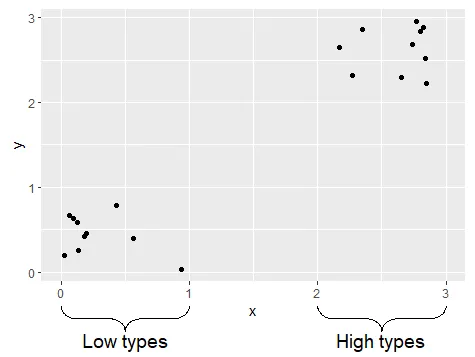
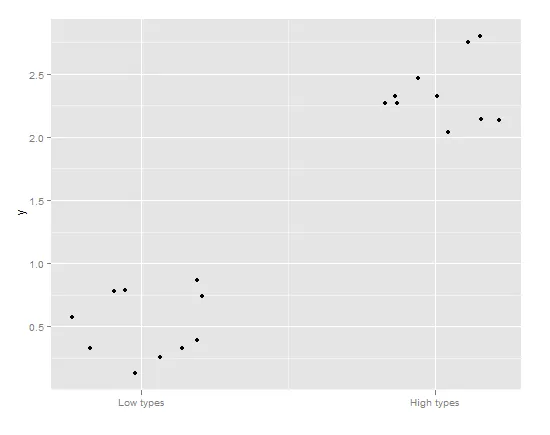
代码在链接的CrossValidated问题中可用(对于这个示例来说过于复杂,因此我不会展示它)。相反,这里是一个最简示例:
library(ggplot2)
x <- c(runif(10),runif(10)+2)
y <- c(runif(10),runif(10)+2)
qplot(x=x,y=y) +
  scale_x_continuous("",breaks=c(.5,2.5),labels=c("Low types","High types") )
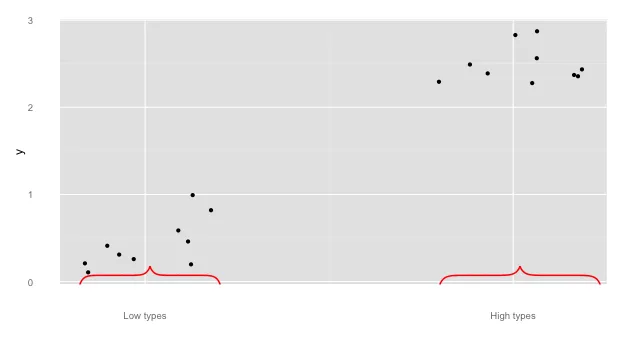
我宁愿不使用
geom_rect,因为:
- 刻度线将保留
- 我更喜欢大括号
- 它将位于图内而不是图外
- 漂亮、平滑、细的花括号
- 在绘图区域之外绘制
- 通过高级参数指定(理想情况下,通过传递给
scale_x_continuous中的breaks选项的范围类型对象)