在ggplot2中添加花括号,然后使用ggsave。

13

因此,这与问题非常相关,并且答案是一个很好的解决方案。

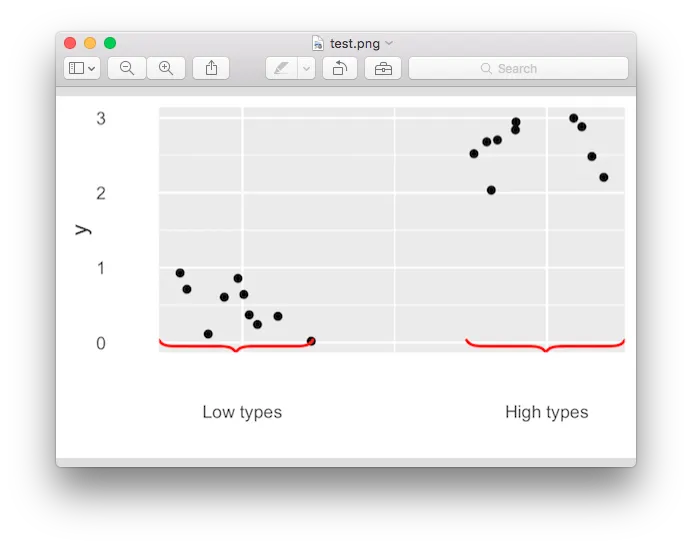
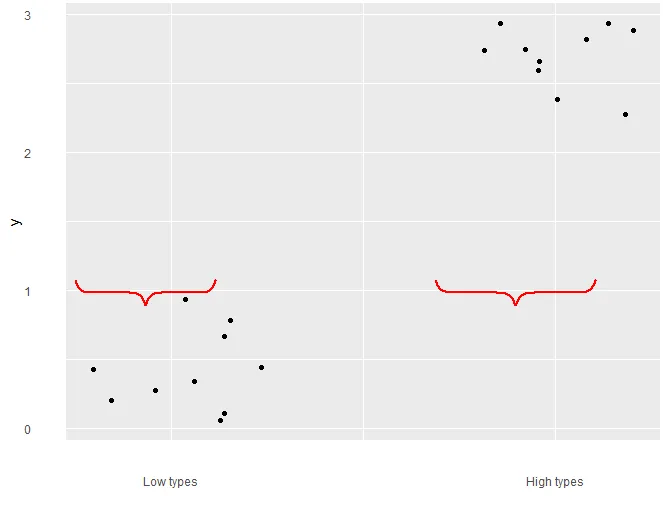
问题是当我尝试使用ggsave导出绘图时,花括号不会显示。

例如:

library(ggplot2)
library(grid)
library(pBrackets) 

x <- c(runif(10),runif(10)+2)
y <- c(runif(10),runif(10)+2)

the_plot <- qplot(x=x,y=y) +
  scale_x_continuous("",breaks=c(.5,2.5),labels=c("Low types","High types") ) +
  theme(axis.ticks = element_blank(),
        axis.ticks.length = unit(.85, "cm"))
the_plot

grid.locator(unit="native") 
bottom_y <- 284 

grid.brackets(220, bottom_y,   80, bottom_y, lwd=2, col="red")
grid.brackets(600, bottom_y,  440, bottom_y, lwd=2, col="red")

ggsave("test.png",width = 4, height = 2.5)

我不想使用RStudio的导出按钮,因为它无法正确导出我的主题字体大小等信息。而且,我需要比76dpi更高的分辨率。我需要一种解决方案来向ggplot2图形添加花括号,并能够使用ggsave保存它。

4个回答

18
我不太理解grid.brackets中使用的逻辑,但如果有一个bracketsGrob函数可以简单地返回一个grob而无需绘制它,那将会有所帮助。也许可以向维护者提出功能请求?
假设这样的函数可用,它可以被馈送到annotation_custom中,使其与ggsave兼容。
bracketsGrob <- function(...){
l <- list(...)
e <- new.env()
e$l <- l
  grid:::recordGrob(  {
    do.call(grid.brackets, l)
  }, e)
}

# note that units here are "npc", the only unit (besides physical units) that makes sense
# when annotating the plot panel in ggplot2 (since we have no access to 
# native units)

b1 <- bracketsGrob(0.33, 0.05, 0, 0.05, h=0.05, lwd=2, col="red")
b2 <- bracketsGrob(1, 0.05, 0.66, 0.05, h=0.05,  lwd=2, col="red")

p <- the_plot + 
  annotation_custom(b1)+ 
  annotation_custom(b2) +
  scale_y_continuous(expand=c(0.11,0))
p

ggsave("test.png", p, width = 4, height = 2.5)

enter image description here


1
是的,那是一个更好的答案。 - Mike Wise
这很棒。总有一天我得学会网格/图形操纵。一个简化:在bracketsGrob中,你不需要创建一个新的环境,你可以传递environment()。它只包含l变量。 - Konrad Rudolph
很棒的答案,对于“npc”单位有一个评论,因为我花了一些时间才理解它(感谢您在答案中明确说明!)。如果您想从x,y值转换,您需要通过轴来缩放它们(所以1 = 轴的末端,0 = 轴的开端)。 - Gooze

3

我想你可以使用设备作为 ggsave 的替代方案,并且我最终成功了。这需要比应该更多的努力,因为 R-Studio 会对哪些设备是打开或关闭状态感到困惑。因此,有时需要重置你的 R 会话。经常检查 dev.list() 也有所帮助,但只是在某种程度上。

但经过一段时间的测试,这个序列相当可靠地工作。我还使用 jpeg 进行了测试,因为我可以在 windows 中使用文件属性命令查看分辨率,以确定我指定的分辨率(200 ppi)是否已传递:

library(ggplot2)
library(grid)
library(pBrackets) 


x <- c(runif(10),runif(10)+2)
y <- c(runif(10),runif(10)+2)
the_plot <- qplot(x=x,y=y) +
  scale_x_continuous("",breaks=c(.5,2.5),labels=c("Low types","High types") ) +
  theme(axis.ticks = element_blank(),
        axis.ticks.length = unit(.85, "cm"))

the_plot

# User has to click here to specify where the brackets go
grid.locator(unit="native") 
bottom_y <- 284 
grid.brackets(220, bottom_y,   80, bottom_y, lwd=2, col="red")
grid.brackets(600, bottom_y,  440, bottom_y, lwd=2, col="red")

#dev.copy(png,"mypng.png",height=1000,width=1000,res=200)
dev.copy(jpeg,"myjpg.jpg",height=1000,width=1000,res=200) 
dev.off()

图片: 输入图像描述 属性: 输入图像描述

2
一个非常晚的回答,我的软件包lemon可以做到这一点,虽然不是花括号,而是方括号。
这里有一个来自vignette的例子 - 它们可以向外和向内指向,更多信息请参见https://cran.r-project.org/package=lemon

enter image description here


0

您可以查看这个this相同问题的答案。这些大括号在导出时没有问题,因为它们基于正常的geom_path。


网页内容由stack overflow 提供, 点击上面的
可以查看英文原文,
原文链接