我有一个使用
使用
ggplot2创建的线图,包含奇数个小面板。我想在空白的区域中添加x值边际分布的箱型图。该箱型图应为横向,并与其他小面板共享相同的x轴。由于默认的箱型图geom是垂直的,需要使用coord_flip()。因此,我不认为可以使用虚拟因子变量将箱型图数据包含在与其他小面板相同的df中进行分面。使用
grid,我可以确定空视口并插入箱型图,但我希望x轴对齐。类似问题的答案(请参见这里或这里)建议使用ggExtra包中的align_plots,但我不认为这适用于分面。我在下面提供了一个简单可重现的示例。如果我解决了这个问题,我还需要编辑空面板Grob以创建与其他小面板匹配的新标签。感谢您的任何建议。library(ggplot2)
#generate df for faceted line graphs
df <- data.frame(x = rep(1:100, times=7),
facet_var = as.factor(rep( 1:7, each=100)),
y = runif(7*100)
)
#create faceted line graphs
p <- ggplot(data = df, aes(x, y)) +
geom_line() + facet_wrap( ~ facet_var, ncol=2)
#generate df for boxplot
xdata <- runif(1000, min = 0, max = 100)
boxdf <- data.frame(x=xdata, group=rep(1,length(xdata)))
#create boxplot removing axes and margins
q <- ggplot(data = boxdf, aes(as.factor(group),x)) + geom_boxplot() +
coord_flip() + labs(x=NULL) +
opts(axis.text.x = theme_blank(), axis.title.x=theme_blank(),
axis.text.y = theme_blank(), axis.title.y=theme_blank(),
axis.ticks = theme_segment(colour = "white"),
panel.margin = 0, plot.margin = unit(rep(0,4), "lines")
)
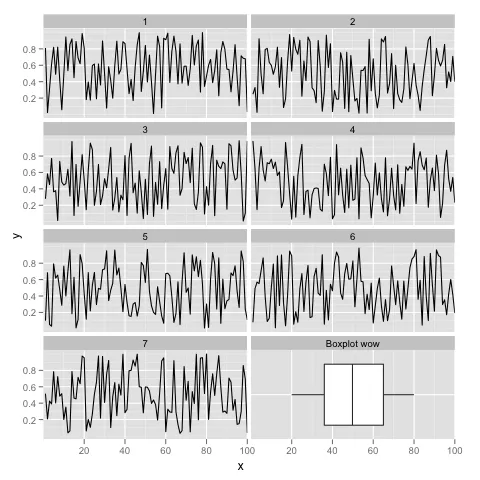
print(p)
downViewport("panel-14-5")
print(q, newpage=F)
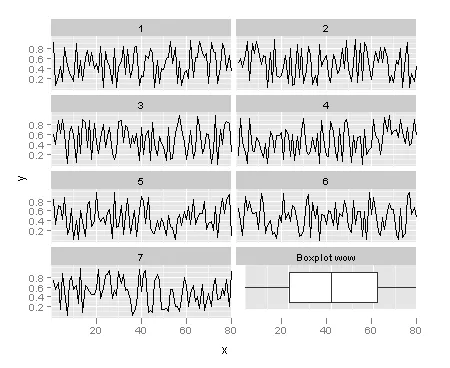
编辑:在得到kohske的帮助后,我尝试着修改代码以适应不同的x轴限制和断点。这里的代码只是将x轴限制和断点改为(0,80)的范围。可能我错过了需要根据限制进行修改的代码。
library(ggplot2)
df <- data.frame(x = rep(1:80, times=7),
        facet_var = as.factor(rep( 1:7, each=80)),
        y = runif(7*80)
      )

# label for marginal plot
df <- rbind(df, data.frame(x = NA, y = NA, facet_var = "Boxplot wow"))

p <- ggplot(data = df, aes(x, y)) +
    geom_line() + facet_wrap( ~ facet_var, ncol=2) +
    # set limits for adjustment
    coord_cartesian(xlim = c(0, 80)) +
    #scale_x_continuous(breaks = 1:4*20)
    opts()

xdata <- runif(1000, min = 0, max = 80)
boxdf <- data.frame(x=xdata, group=rep(1,length(xdata)))

q <- ggplot(data = boxdf, aes(as.factor(group),x)) + geom_boxplot() +

    # set breaks and limits for adjustment
    coord_flip(ylim = c(0, 80)) + labs(x=NULL) +
    scale_y_continuous(breaks = 1:4*20) +

    # opts for full region drawing:
    # see https://kohske.wordpress.com/2010/12/25/drawing-on-full-region-in-ggplot2/
    opts(
    legend.position = "none",
    panel.margin = unit(0,"null"),
    plot.margin = rep(unit(0,"null"),4),
    axis.ticks = theme_blank(),
    axis.text.x = theme_blank(),
    axis.text.y = theme_blank(),
    axis.title.x = theme_blank(),
    axis.title.y = theme_blank(),
    axis.ticks.length = unit(0,"null"),
    axis.ticks.margin = unit(0,"null")
  )

print(p)

# remove unused panel
grid.remove("panel-14-5")

downViewport("panel-14-5")
print(q, newpage=F)
ggExtra中是否已将完整区域绘图选项作为主题合并? - Sandyopts_fullhttp://ggextra.googlecode.com/svn/trunk/R/themes.r,但是希望`ggExtra`不会再存在太久。 - baptiste