使用ggplot2绘制的网格显示不清楚

8
我正在尝试在天空上绘制天体(基本上具有与纬度/经度等效的坐标)。我使用
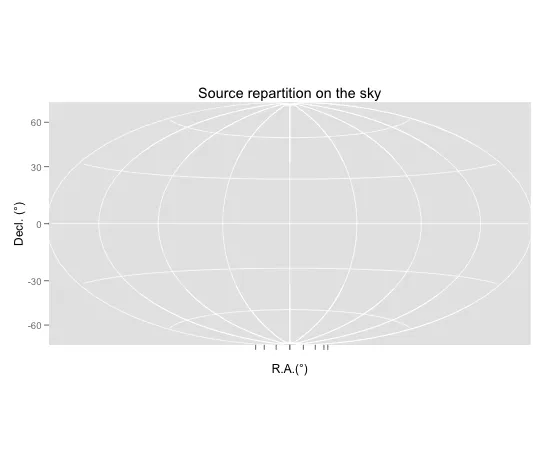
coord_map函数的"aitoff"投影成功地绘制了所有点,但在这种情况下,网格显示得很差,即非零纬度仍显示其正确投影以及残留的水平线。
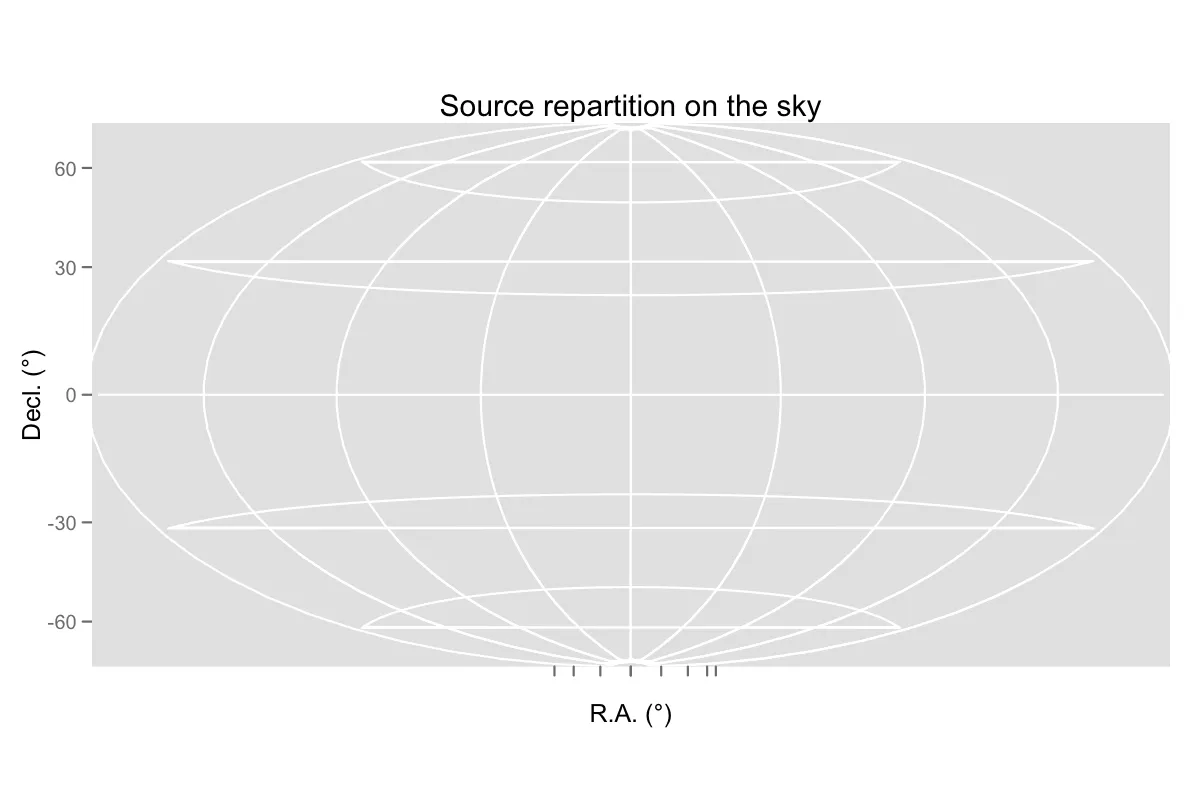
enter image description here

如何去除这些线?

以下是重现此行为的代码:

library(ggplot2)
library(mapproj)
sky2 = data.frame(RA=0, Dec=0)
skyplot2 <- qplot(RA,Dec,data=sky2,xlim=c(0,360),ylim=c(-89.999,89.999),
xlab="R.A.(°)", ylab="Decl. (°)",main="Source repartition on the sky")
skyplot2 + coord_map(projection="aitoff",orientation=c(89.999,180,0)) + 
scale_y_continuous(breaks=(-2:2)*30,limits=c(-89.999,89.999)) + 
scale_x_continuous(breaks=(0:8)*45,limits=c(0,360),
                   labels=c("","","","","","","","",""))
2个回答

4

这明显是ggplot2中的一个bug,请你能否报告这个bug呢? https://github.com/hadley/ggplot2/issues?state=open 已经报告为一个bug

这里有一个快速而不太正规的hack方法。

f <- function(x, y, ...) {
    if (any(is.na(x))) {
    id <- rle(!is.na(x))$length
    id <- rep(seq_along(id), id)
    df <- data.frame(x, y, id)
    df <- df[order(df$id, df$x), ]
  } else if (any(is.na(y))) {
    id <- rle(!is.na(y))$length
    id <- rep(seq_along(id), id)
    df <- data.frame(x, y, id)
  }
  polylineGrob(df$x, df$y, id = df$id, gp = gpar(col = "white"))
}

skyplot2 <- qplot(RA,Dec,data=sky2,xlim=c(0,360),ylim=c(-89.999,89.999),
                  xlab="R.A.(°)", ylab="Decl. (°)",main="Source repartition on the sky")
skyplot2 + coord_map(projection="aitoff",orientation=c(89.999,180,0)) + 
  scale_y_continuous(breaks=(-2:2)*30,limits=c(-89.999,89.999)) + 
  scale_x_continuous(breaks=(0:8)*45,limits=c(0,360),
                     labels=c("","","","","","","","","")) +
                    opts(panel.grid.major = f)

请注意,这可能仅适用于AITOFF投影。

输入图像说明


2
您只需要添加以下内容:
+ opts(axis.ticks = theme_blank())

嗯。这样可以去掉图形底部的刻度线,但不能去掉原帖想要删除的额外(直)水平线。 - Josh O'Brien

网页内容由stack overflow 提供, 点击上面的
可以查看英文原文,
原文链接