使用fill_between方法在matplotlib中创建彩色三角形

3

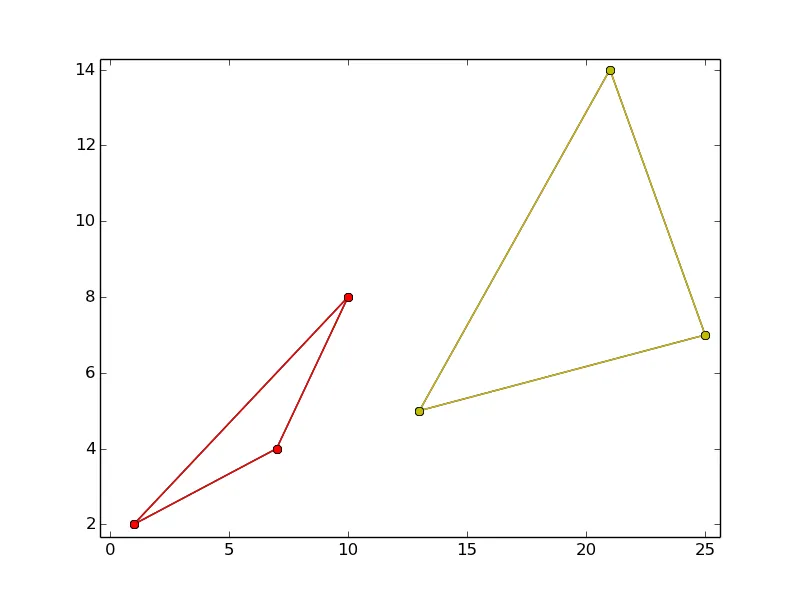
我已经通过下面的代码在空间中绘制了随机三角形,但是我想填充三角形的颜色。我知道matplotlib中的fill_between()函数,但是我不确定如何在下面的示例中实现它。

import matplotlib.pyplot as plt

trianglex = [ 1, 10, 7, 1 ] #repeated last coordinates so that the last coordinate joins the first coordinate to form the outline of the triangle
triangley = [ 2, 8, 4, 2 ]

triangle2x = [ 13, 25, 21, 13]
triangle2y = [ 5,  7 , 14, 5 ]


plt.figure('Triangles')
for i in range(3):
    plt.plot( trianglex, triangley, 'o-')

for i in range(3):
    plt.plot( triangle2x, triangle2y, 'o-')

plt.show()

这提供了三角形

1个回答

6
您可以按照以下方式使用plt.fill()
import matplotlib.pyplot as plt

trianglex = [ 1, 10, 7, 1 ] 
triangley = [ 2, 8, 4, 2 ]    
triangle2x = [ 13, 25, 21, 13]
triangle2y = [ 5,  7 , 14, 5 ]

plt.figure('Triangles')
for i in range(3):
    plt.plot(trianglex, triangley, 'o-')
plt.fill(trianglex, triangley)

for i in range(3):
    plt.plot( triangle2x, triangle2y, 'o-')
plt.fill(triangle2x, triangle2y)

plt.show()

输出

这里输入图片描述


网页内容由stack overflow 提供, 点击上面的
可以查看英文原文,
原文链接