Matplotlib的fill_between与plot_date不兼容,有什么替代方法吗?

11

我希望能创建一个类似这样的图形: 这个图有整数x值

代码:

P.fill_between(DF.start.index, DF.lwr, DF.upr, facecolor='blue',   alpha=.2)
P.plot(DF.start.index, DF.Rt, '.')

但是x轴上有日期,就像这样(没有带状图): with plot_date

代码:

P.plot_date(DF.start, DF.Rt, '.')

问题在于当x值为日期时间对象时,fill_between函数会失败。

有人知道解决方法吗?DF是一个pandas DataFrame。


5
这个配方在这里展示为有效:http://matplotlib.org/users/recipes.html#fill-between-and-alpha 但是我得到了以下错误:condition = ~(np.isfinite(a)) TypeError: ufunc 'isfinite' not supported for the input types, and the inputs could not be safely coerced to any supported types according to the casting rule ''safe''。注:该错误提示中的“ufunc 'isfinite' not supported for the input types”表示无法支持输入类型的函数“isfinite”,而“coerced to any supported types according to the casting rule 'safe'”表示按照“safe”转换规则也无法将其安全地强制转换为任何受支持的类型。 - fccoelho
DF.info()的输出结果: <class 'pandas.core.frame.DataFrame'> Int64Index: 967条记录,从0到966 数据列(共9列): SE 非空int64类型 start 非空object类型 end 非空object类型 cases 非空int64类型 Rt 非空float64类型 Rt2 非空float64类型 p1 非空float64类型 lwr 非空float64类型 upr 非空float64类型 数据类型:float64(5个),int64(2个),object(2个) 内存使用情况:75.5+ KB - fccoelho
1
通过使用to_pydatetime()将numpy datetime64[ns]类型转换为Python datetime.datetime对象数组。解决方案来自于这里 - BaluJr.
4个回答

20

如果您展示一下如何定义df,那会很有帮助。 df.info()报告了什么?这将向我们展示列的数据类型。

日期可以用许多方式表示:作为字符串、整数、浮点数、datetime.datetime、NumPy datetime64s、Pandas Timestamps或Pandas DatetimeIndex。正确的绘图方式取决于您拥有的内容。

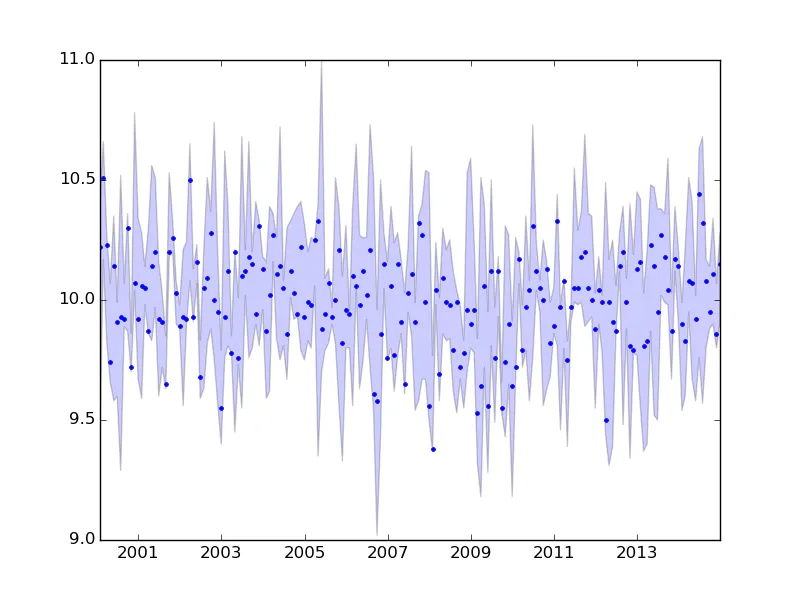
以下是一个示例,如果df.index是DatetimeIndex,显示代码的工作方式:

import numpy as np
import pandas as pd
import matplotlib.pyplot as plt
from scipy import stats

index = pd.date_range(start='2000-1-1', end='2015-1-1', freq='M')
N = len(index)
poisson = (stats.poisson.rvs(1000, size=(N,3))/100.0)
poisson.sort(axis=1)
df = pd.DataFrame(poisson, columns=['lwr', 'Rt', 'upr'], index=index)

plt.fill_between(df.index, df.lwr, df.upr, facecolor='blue', alpha=.2)
plt.plot(df.index, df.Rt, '.')
plt.show()

如果索引包含日期的字符串表示,则(在Matplotlib版本1.4.2中)会出现TypeError错误:

enter image description here


import numpy as np
import pandas as pd
import matplotlib.pyplot as plt
from scipy import stats

index = pd.date_range(start='2000-1-1', end='2015-1-1', freq='M')
N = len(index)
poisson = (stats.poisson.rvs(1000, size=(N,3))/100.0)
poisson.sort(axis=1)
df = pd.DataFrame(poisson, columns=['lwr', 'Rt', 'upr'])

index = [item.strftime('%Y-%m-%d') for item in index]
plt.fill_between(index, df.lwr, df.upr, facecolor='blue', alpha=.2)
plt.plot(index, df.Rt, '.')
plt.show()
产出。
  File "/home/unutbu/.virtualenvs/dev/local/lib/python2.7/site-packages/numpy/ma/core.py", line 2237, in masked_invalid
    condition = ~(np.isfinite(a))
TypeError: Not implemented for this type

在这种情况下,解决方法是将字符串转换为时间戳:

index = pd.to_datetime(index)

如果日期列由Pandas的datetime64对象组成,那该怎么办?我需要将其转换为其他类型吗?有没有办法在这些对象上使用fill_between()函数? - chilliq
没有问题;plt.plotplt.fill_between可以很好地接受datetime64[ns]类型的数组。 - unutbu
7
当我使用datetime64和plt.fill_between()时,出现了以下错误:TypeError: ufunc 'isfinite' not supported for the input types, and the inputs could not be safely coerced to any supported types according to the casting rule ''safe''。那么这个错误的原因应该是其他地方引起的吗? @unutbu - chilliq
1
@chilliq:你能否准备一个小例子来展示这个问题,并在一个新的问题中发布它?谷歌搜索“TypeError: ufunc 'isfinite' not supported for the input types”显示,这个错误可能是由于matplotlib的版本或使用dtype为“object”的NumPy数组引起的。还有其他可能的原因。因此,如果没有可重现的例子,很难知道是什么导致了你的问题。 - unutbu
1
您IP地址为143.198.54.68,由于运营成本限制,当前对于免费用户的使用频率限制为每个IP每72小时10次对话,如需解除限制,请点击左下角设置图标按钮(手机用户先点击左上角菜单按钮)。 - chilliq
我曾经遇到了ufunc错误,因为我的日期格式不正确。我将它们转换为datetimes后,ufunc错误消失了,一切都运行得很顺利。 - Ezekiel Kruglick

2

关于chilliq报告的错误:

TypeError: ufunc 'isfinite' not supported for the input types, and the inputs 
  could not be safely coerced to any supported types according to the casting 
  rule ''safe''

如果使用fill_between时DataFrame列具有“object” dtype,则会产生此问题。更改示例列类型,然后尝试绘制,结果会出现上述错误:
import numpy as np
import pandas as pd
import matplotlib.pyplot as plt
from scipy import stats

index = pd.date_range(start='2000-1-1', end='2015-1-1', freq='M')
N = len(index)
poisson = (stats.poisson.rvs(1000, size=(N,3))/100.0)
poisson.sort(axis=1)
df = pd.DataFrame(poisson, columns=['lwr', 'Rt', 'upr'], index=index)
dfo = df.astype(object)

plt.fill_between(df0.index, df0.lwr, df0.upr, facecolor='blue', alpha=.2)
plt.show()

通过 dfo.info() 我们可以看到列的类型为 "object":

<class 'pandas.core.frame.DataFrame'>
DatetimeIndex: 180 entries, 2000-01-31 to 2014-12-31
Freq: M
Data columns (total 3 columns):
lwr    180 non-null object
Rt     180 non-null object
upr    180 non-null object
dtypes: object(3)
memory usage: 5.6+ KB

确保DataFrame具有数字列将解决问题。我们可以使用pandas.to_numeric进行转换,如下所示:

dfn = dfo.apply(pd.to_numeric, errors='ignore')

plt.fill_between(dfn.index, dfn.lwr, dfn.upr, facecolor='blue', alpha=.2)
plt.show()

2

在使用fill_between时,我遇到了类似的错误:

最初的回答:

ufunc 'bitwise_and' not supported

然而,在我的情况下,错误的原因相当愚蠢。我传递了颜色参数,但没有明确指定参数名称,这导致它成为第四个被调用的参数where。所以,确保关键字参数具有键名就可以解决问题: "最初的回答"
ax.fill_between(xdata, highs, lows, color=color, alpha=0.2)

1
我认为没有一个答案回答了原始问题,它们都稍微改变了一下。
如果你想绘制时间差,你可以使用这个解决方法。
ax = df.Rt.plot()
x = ax.get_lines()[0].get_xdata().astype(float)
ax.fill_between(x, df.lwr, df.upr, color="b", alpha=0.2)
plt.show()

这对你来说是有效的。一般来说,唯一需要注意的是你总是需要使用pandas绘制索引,然后从艺术家那里获取坐标。我相信通过查看pandas代码,人们实际上可以找到他们如何绘制时间差。然后可以将其应用于代码,第一个图不再需要。

唯一对我有用的答案是使用时间增量作为索引。 - squarespiral

网页内容由stack overflow 提供, 点击上面的
可以查看英文原文,
原文链接