是否在CRAN上有关于两段正态分布的密度函数:

我想在编写代码之前先检查一下。我已经查看了分布任务视图,但没有找到该函数。我已经查看了几个可能的程序包,但均未找到。
更新:我已将 dsplitnorm、psplitnorm、qsplitnorm 和 rsplitnorm 函数添加到 fanplot 程序包中。
是否在CRAN上有关于两段正态分布的密度函数:
我想在编写代码之前先检查一下。我已经查看了分布任务视图,但没有找到该函数。我已经查看了几个可能的程序包,但均未找到。
更新:我已将 dsplitnorm、psplitnorm、qsplitnorm 和 rsplitnorm 函数添加到 fanplot 程序包中。
vignette(“distr”)获得。)library(distr)
## Construct the distribution object.
## Here, it's a split normal distribution with mode=0, and lower- and
## upper-half standard deviations of 1 and 2, respectively.
splitNorm <- UnivarMixingDistribution(Truncate(Norm(0,2), upper=0),
Truncate(Norm(0,1), lower=0),
mixCoeff=c(0.5, 0.5))
## Construct its density function ...
dsplitNorm <- d(splitNorm)
## ... and a function for sampling random variates from it
rsplitNorm <- r(splitNorm)
## Compare the density it returns to that from rnorm()
dsplitNorm(-1)
# [1] 0.1760327
dnorm(-1, sd=2)
# [1] 0.1760327
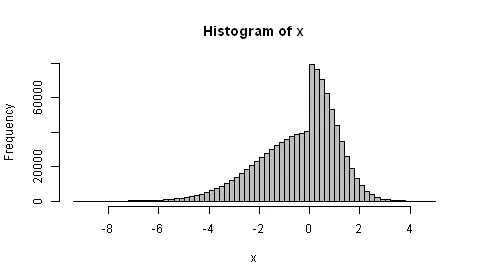
## Sample and plot a million random variates from the distribution
x <- rsplitNorm(1e6)
hist(x, breaks=100, col="grey")
## Plot the distribution's continuous density
plot(splitNorm, to.draw.arg="d")
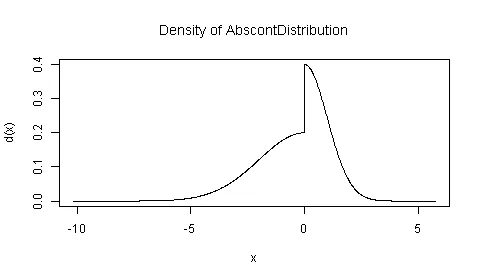
ifelse(x < 0, dnorm(x, mean=0, sd=2), dnorm(x, mean=0, sd=1))(对于一个具有 mode=0、下半部分 sd=2 和上半部分 sd=1 的分布)。 - Josh O'Brien