独立的坐标轴用于pandas箱线图中每个子图

4
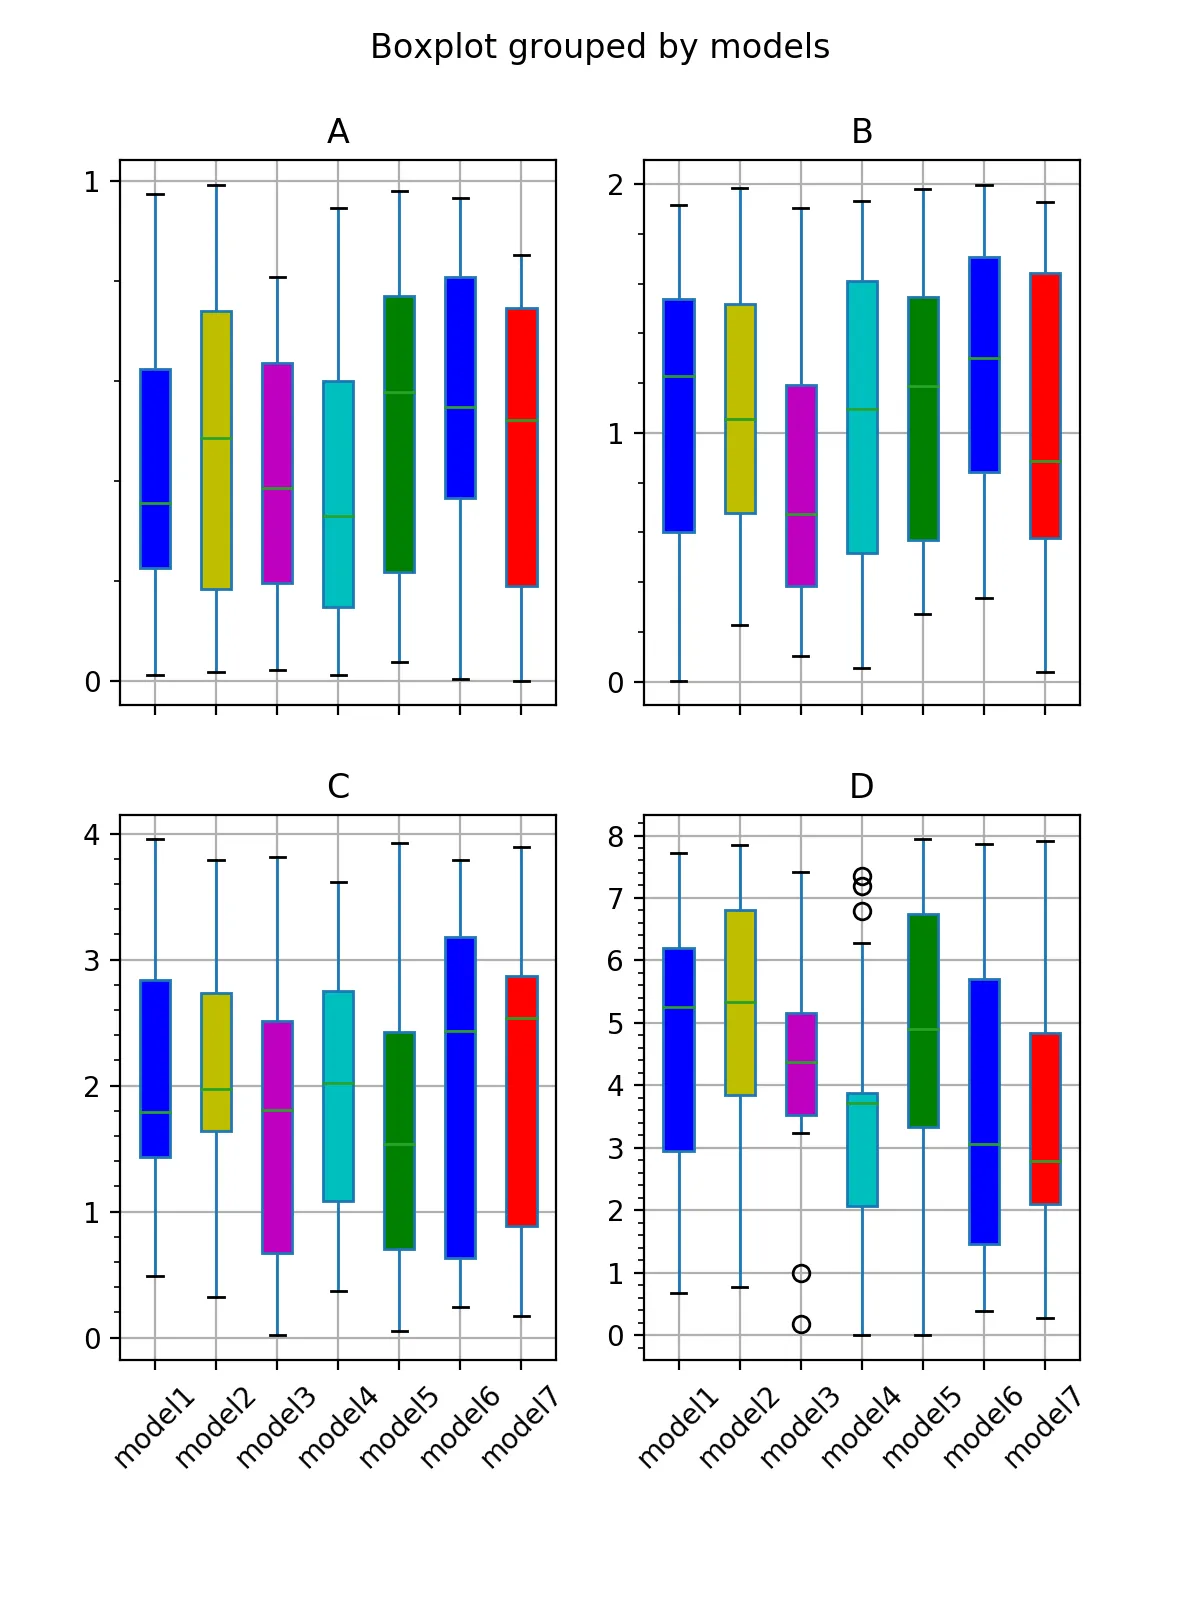
以下代码可帮助获得具有独特彩色框的子图。但是所有子图共享一个公共的x和y轴。我希望每个子图都有独立的坐标轴:
import pandas as pd
import numpy as np
import matplotlib.pyplot as plt
from matplotlib.patches import PathPatch

df = pd.DataFrame(np.random.rand(140, 4), columns=['A', 'B', 'C', 'D'])

df['models'] = pd.Series(np.repeat(['model1','model2', 'model3', 'model4',     'model5', 'model6', 'model7'], 20))

bp_dict = df.boxplot(
by="models",layout=(2,2),figsize=(6,4),
return_type='both',
patch_artist = True,
)

colors = ['b', 'y', 'm', 'c', 'g', 'b', 'r', 'k', ]
for row_key, (ax,row) in bp_dict.iteritems():
    ax.set_xlabel('')
    for i,box in enumerate(row['boxes']):
        box.set_facecolor(colors[i])

plt.show()

这里是上述代码的输出:enter image description here 
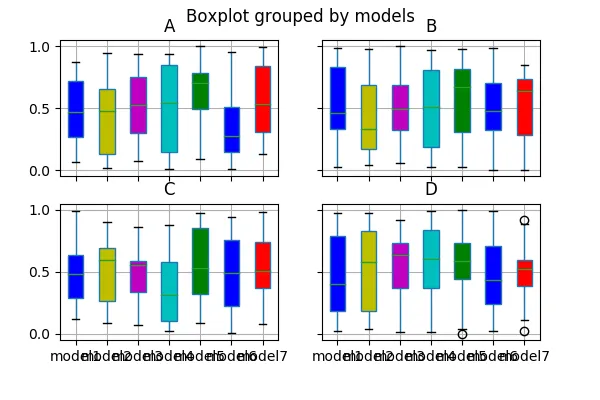
我试图在每个子图中使用独立的 x 和 y 轴…enter image description here
3个回答

2

在调用df.boxplot()之前,您需要预先创建图形和子图,并将其作为参数传递。这也意味着您可以删除参数layout=(2,2)

fig, axes = plt.subplots(2,2,sharex=False,sharey=False)

然后使用:

bp_dict = df.boxplot(
by="models", ax=axes, figsize=(6,4),
return_type='both',
patch_artist = True,
)

感谢您的回答...将布局限制为plt.subplots会强制网格框的数量等于所需的子图数。您能否建议一种相对简单的方法来容纳2xn布局中的13个子图?如果我在df.boxplot中使用布局参数,则轴会保持共享.. - JALO - JusAnotherLivngOrganism

1
你可以通过以下方式再次设置刻度标签可见,例如:
plt.setp(ax.get_xticklabels(), visible=True)

这并不意味着轴是独立的,它们仍然彼此绑定,但看起来你在询问可见性而不是共享行为。

谢谢您的回答。但是我想要每个轴都有独立的范围(特别是y轴,每个子图的ylim需要分开设置)。绑定范围会限制那些数据范围较低但轴范围较高的箱子的视图。 - JALO - JusAnotherLivngOrganism
在那种情况下,请参考另一个答案。 - ImportanceOfBeingErnest

1
如果您真的认为有必要在创建boxplot数组之后取消共享轴,则可以这样做,但是您必须手动完成所有操作。在stackoverflow上搜索一段时间并查看matplotlib文档页面后,我提出了以下解决方案,以取消共享Axes实例的yaxes,对于xaxes,您需要类似地进行操作:
import pandas as pd
import numpy as np
import matplotlib.pyplot as plt
from matplotlib.patches import PathPatch
from matplotlib.ticker import AutoLocator, AutoMinorLocator

##using differently scaled data for the different random series:
df = pd.DataFrame(
    np.asarray([
        np.random.rand(140),
        2*np.random.rand(140),
        4*np.random.rand(140),
        8*np.random.rand(140),
    ]).T,
    columns=['A', 'B', 'C', 'D']
)

df['models'] = pd.Series(np.repeat([
    'model1','model2', 'model3', 'model4',   'model5', 'model6', 'model7'
], 20))

##creating the boxplot array:
bp_dict = df.boxplot(
    by="models",layout = (2,2),figsize=(6,8),
    return_type='both',
    patch_artist = True,
    rot = 45,
)

colors = ['b', 'y', 'm', 'c', 'g', 'b', 'r', 'k', ]

##adjusting the Axes instances to your needs
for row_key, (ax,row) in bp_dict.items():
    ax.set_xlabel('')

    ##removing shared axes:
    grouper = ax.get_shared_y_axes()
    shared_ys = [a for a in grouper]
    for ax_list in shared_ys:
        for ax2 in ax_list:
            grouper.remove(ax2)

    ##setting limits:
    ax.axis('auto')
    ax.relim()      #<-- maybe not necessary

    ##adjusting tick positions:
    ax.yaxis.set_major_locator(AutoLocator())
    ax.yaxis.set_minor_locator(AutoMinorLocator())

    ##making tick labels visible:    
    plt.setp(ax.get_yticklabels(), visible=True)

    for i,box in enumerate(row['boxes']):
        box.set_facecolor(colors[i])

plt.show()

生成的图表如下所示:

result of the above code

说明:

首先,您需要告诉每个Axes实例不要与任何其他Axis实例共享其yaxis这篇文章让我了解到如何做到这一点 - Axes.get_shared_y_axes()返回一个Grouper对象,其中包含对所有其他Axes实例的引用,当前Axes应该与其共享其xaxis。 遍历这些实例并调用Grouper.remove实际上取消共享。

一旦 yaxis 不再共享,需要调整 y 轴限制和 y 刻度。前者可以使用 ax.axis('auto')ax.relim()(不确定第二个命令是否必要)实现。可以使用适当的 定位器 使用 ax.yaxis.set_major_locator()ax.yaxis.set_minor_locator() 调整刻度。最后,可以使用 plt.setp(ax.get_yticklabels(), visible=True)参见此处)使刻度标签可见。

考虑到这一点,我认为 @DavidG 的 答案 是更好的方法。


网页内容由stack overflow 提供, 点击上面的
可以查看英文原文,
原文链接