我正在尝试绘制多面板图,每个面板都有自己的图例。然而,我遇到了一些问题,无法将它们正确地对齐。
dat <- structure(list(group1 = structure(c(1L, 1L, 2L, 2L, 2L), .Label = c("A",
"B"), class = "factor"), group2 = structure(c(1L, 2L, 1L, 3L,
2L), .Label = c("a", "b", "c"), class = "factor"), x = c("1",
"2", "3", "4", "2"), y = c("1", "2", "3", "4", "3")), .Names = c("group1",
"group2", "x", "y"), row.names = c(NA, 5L), class = "data.frame")

dat <- split(dat, f = dat$group1)

library(ggplot2)
p1 <- ggplot(dat$A) +
  geom_point(aes(x=x, y=y, colour=group2)) +
  facet_wrap(~group1) +
  guides(colour=guide_legend(nrow=2)) +
  scale_colour_manual(values=c(a = "green", b = "red", c = "blue"),
                      labels=c(a = "green", b = "red", c = "blue"))

p2 <- p1 %+% dat$B
使用
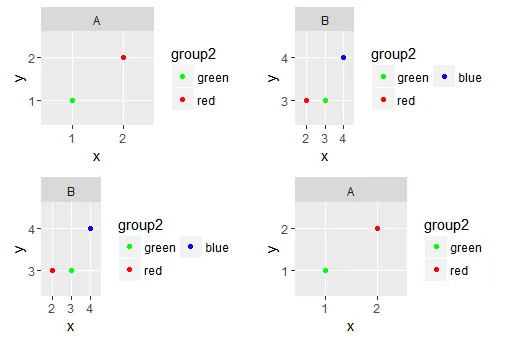
gridExtra的问题是图形不对齐:library(gridExtra)
grid.arrange(p1, p2, p2, p1, ncol=2)
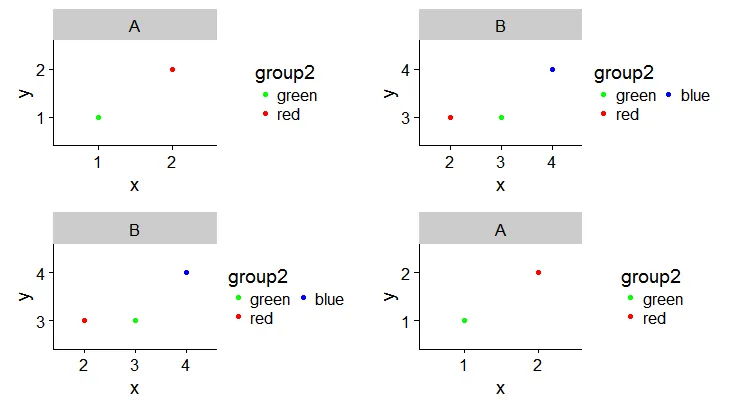
使用cowplot后,图例有些居中:
library(cowplot)
plot_grid(p1, p2, p2, p1, ncol=2, align="hv")
我尝试添加
legend.justification 和/或 legend.position,但没有效果。
guides(col = guide_legend(nrow = 3)),以便图例占用相同的宽度大小。 - zx8754