我正在尝试创建一个人口金字塔,跨越多个地区。问题是这些地区的人口规模非常不同,导致y轴上的比例尺存在问题(坐标翻转)。我试图按照此处描述的方法进行操作:https://rpubs.com/walkerke/pyramids_ggplot2 - 通过使用负数表示一种性别来制作金字塔,然后使用
我可以建立人口金字塔,并按国家进行分面展示:
是否有一种方法可以设置scale_y_continuous(),以便我可以在不同的facet中具有不同的刻度,同时保持:scales = free_x。否则,是否有其他方法可以使用除scale_y_continuous()之外的其他方法消除金字塔中的负数。
如果不能,那么唯一的方法就是分别开发每个图像,然后使用ggarrange()或cowplot()手动分面?
编辑:
根据评论,我尝试使用facetscales(),但我无法让它按照我想要的方式工作,也无法完全理解man文件。
使用此处的指令:https://github.com/zeehio/facetscales,我安装并加载了该软件包。
然后我创建了刻度列表:
正如清楚所示,比例尺是固定的,而且man页面也说我可以使用
最后,我真的希望在两行三列中有六个区域。man页面表明我可以使用rows和cols来分面不同的变量,但是我没有看到任何关于单个变量的
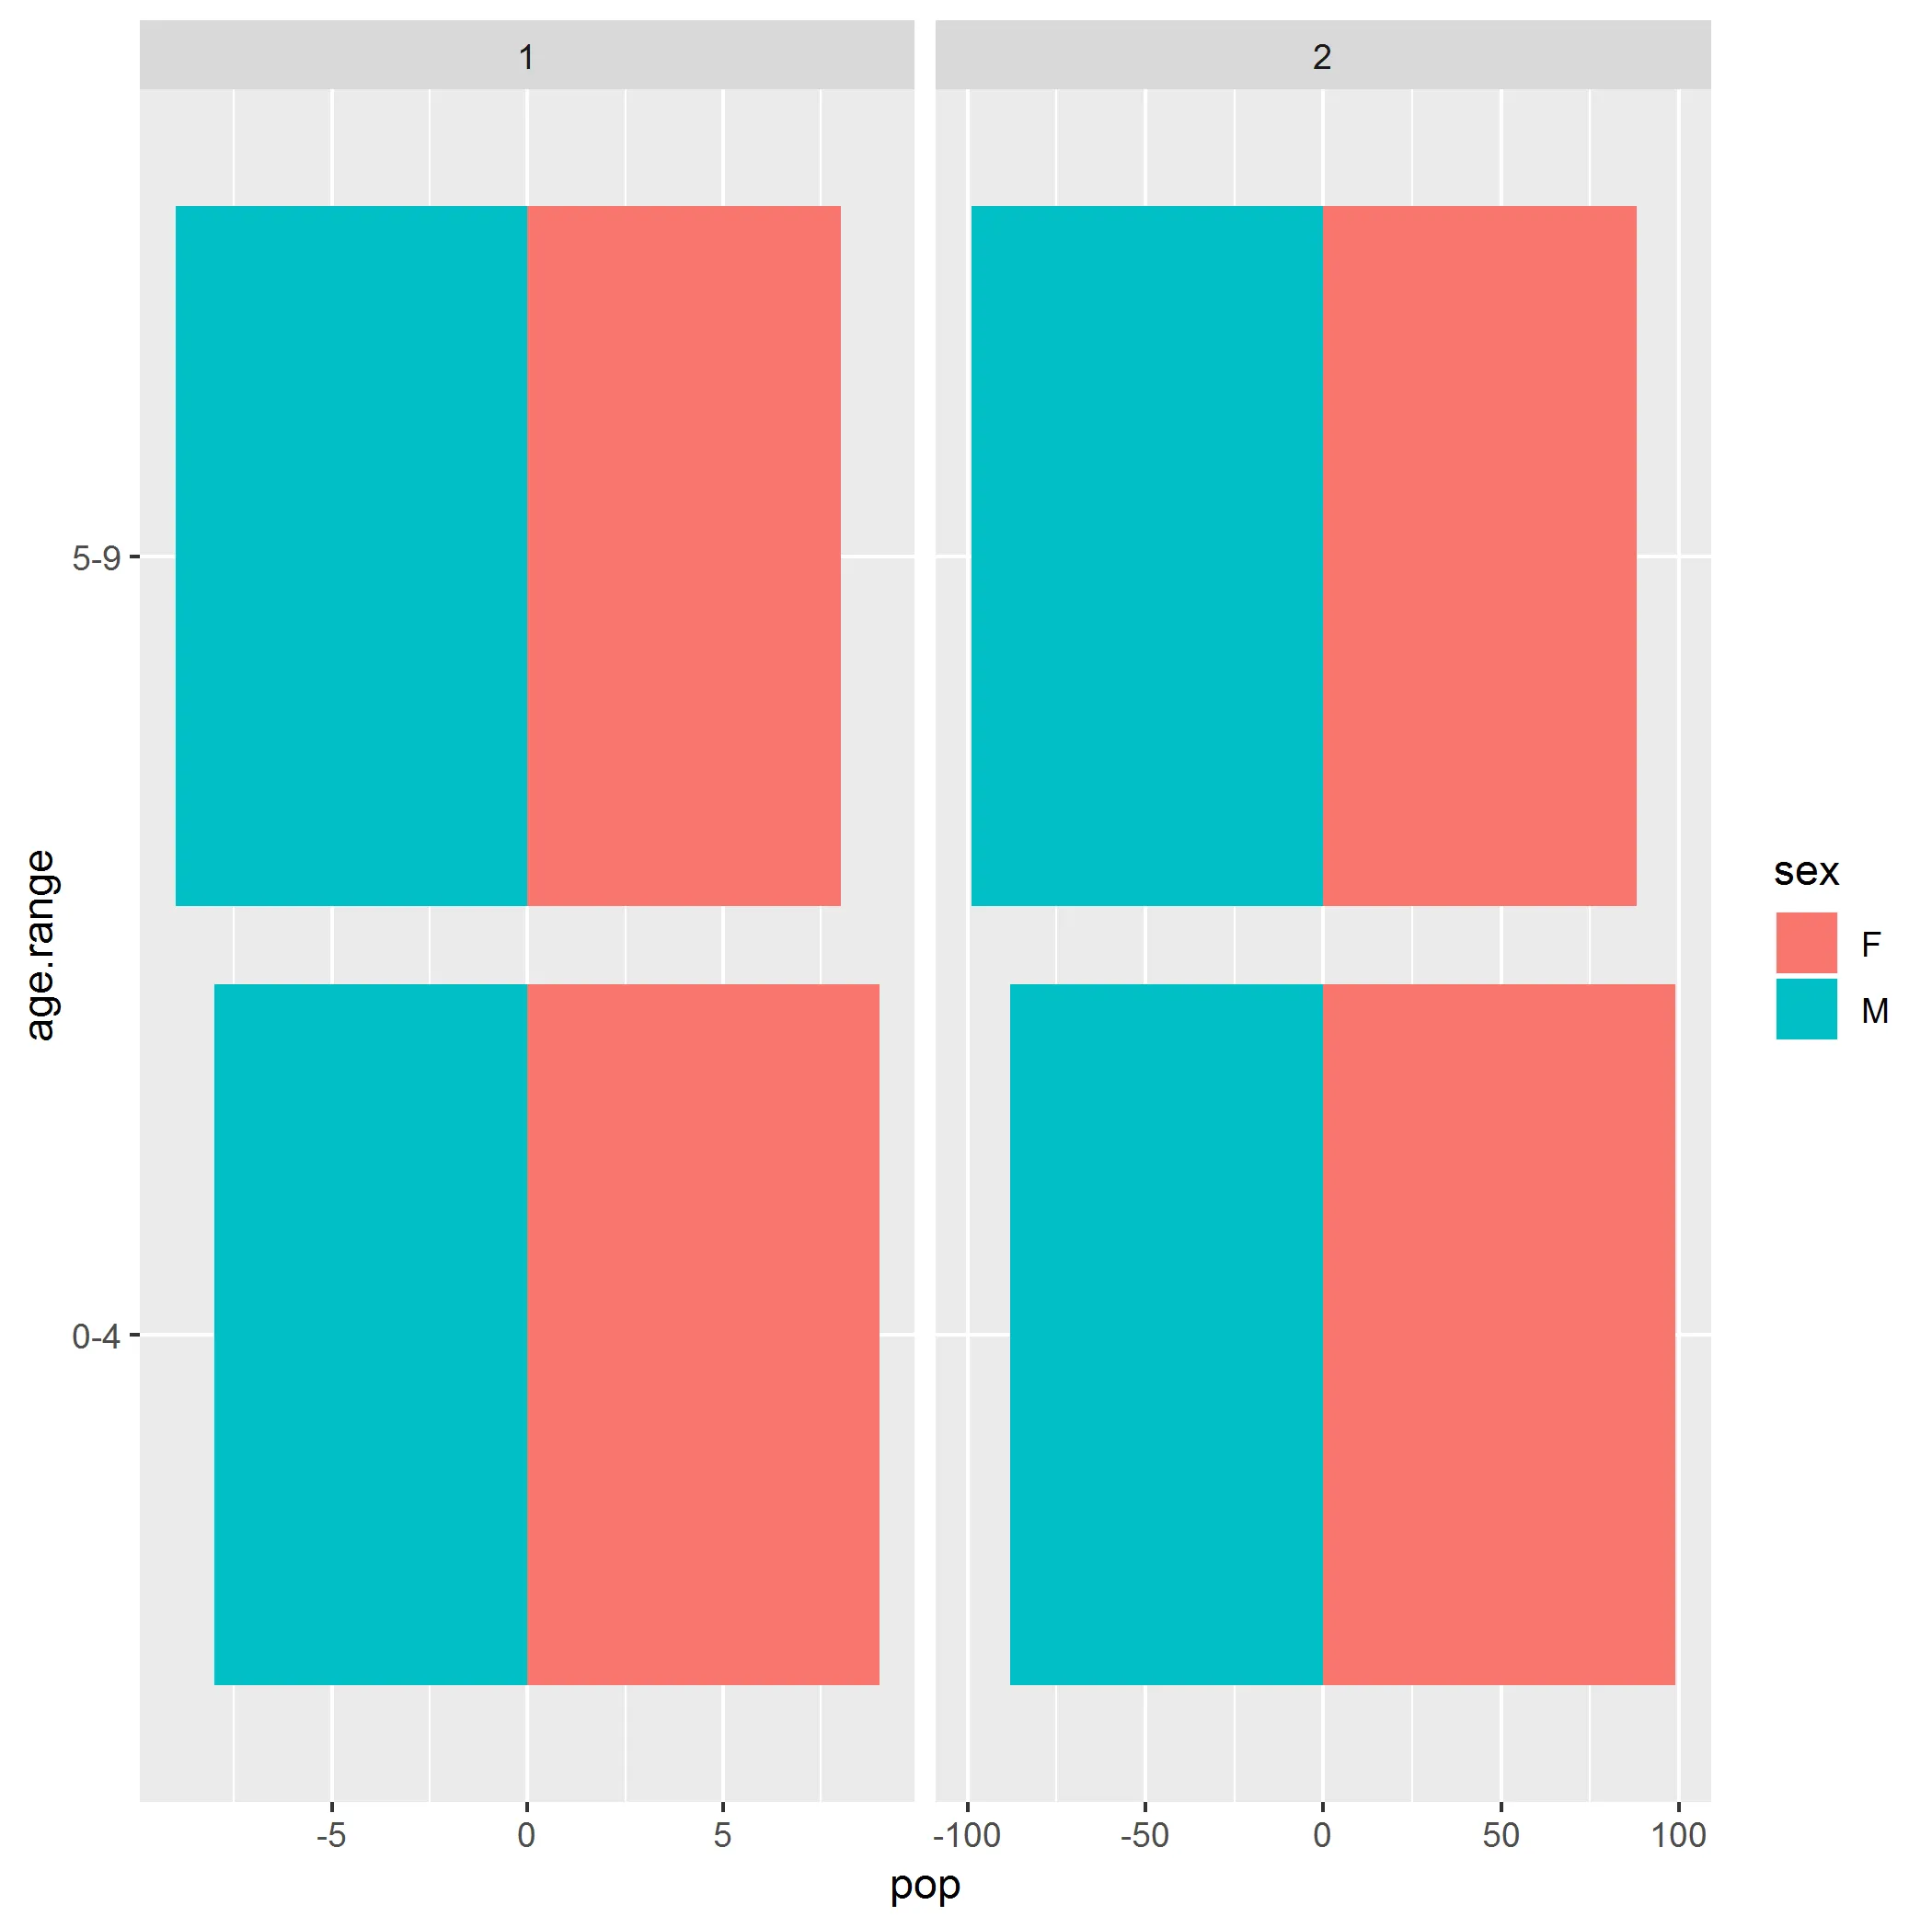
scale_y_continuous()来消除负数。首先,我为两个国家的两个年龄组创建了一个简单的样本数据集:country <- c(1, 1, 1, 1, 2, 2, 2, 2)
age.range <- c("0-4", "0-4", "5-9", "5-9", "0-4", "0-4", "5-9", "5-9")
sex <- rep(c("M", "F"), times = 4)
pop <- c(-8, 9, -9, 8, -88, 99, -99, 88)
pop.pyr <- data.frame(country, age.range, sex, pop)
pop.pyr
country age.range sex pop
1 1 0-4 M -8
2 1 0-4 F 9
3 1 5-9 M -9
4 1 5-9 F 8
5 2 0-4 M -88
6 2 0-4 F 99
7 2 5-9 M -99
8 2 5-9 F 88
我可以建立人口金字塔,并按国家进行分面展示:
library(ggplot2)

ggplot(pop.pyr, aes(x = age.range, y = pop, fill = sex)) +
  geom_col(data = subset(pop.pyr, sex == "M")) +
  geom_col(data = subset(pop.pyr, sex == "F")) +
  coord_flip() +
  facet_wrap(~ country, scales = "free_x")
coord_flip()),我需要使用:scale_y_continuous();但这样做意味着我必须为两个部分选择一个scale_y_continuous(),这是不可行的。ggplot(pop.pyr, aes(x = age.range, y = pop, fill = sex)) +
geom_col(data = subset(pop.pyr, sex == "M")) +
geom_col(data = subset(pop.pyr, sex == "F")) +
coord_flip() +
facet_wrap(~ country, scales = "free_x") +
scale_y_continuous(breaks = seq(-100, 100, 20), labels = abs(seq(-100, 100, 20)))
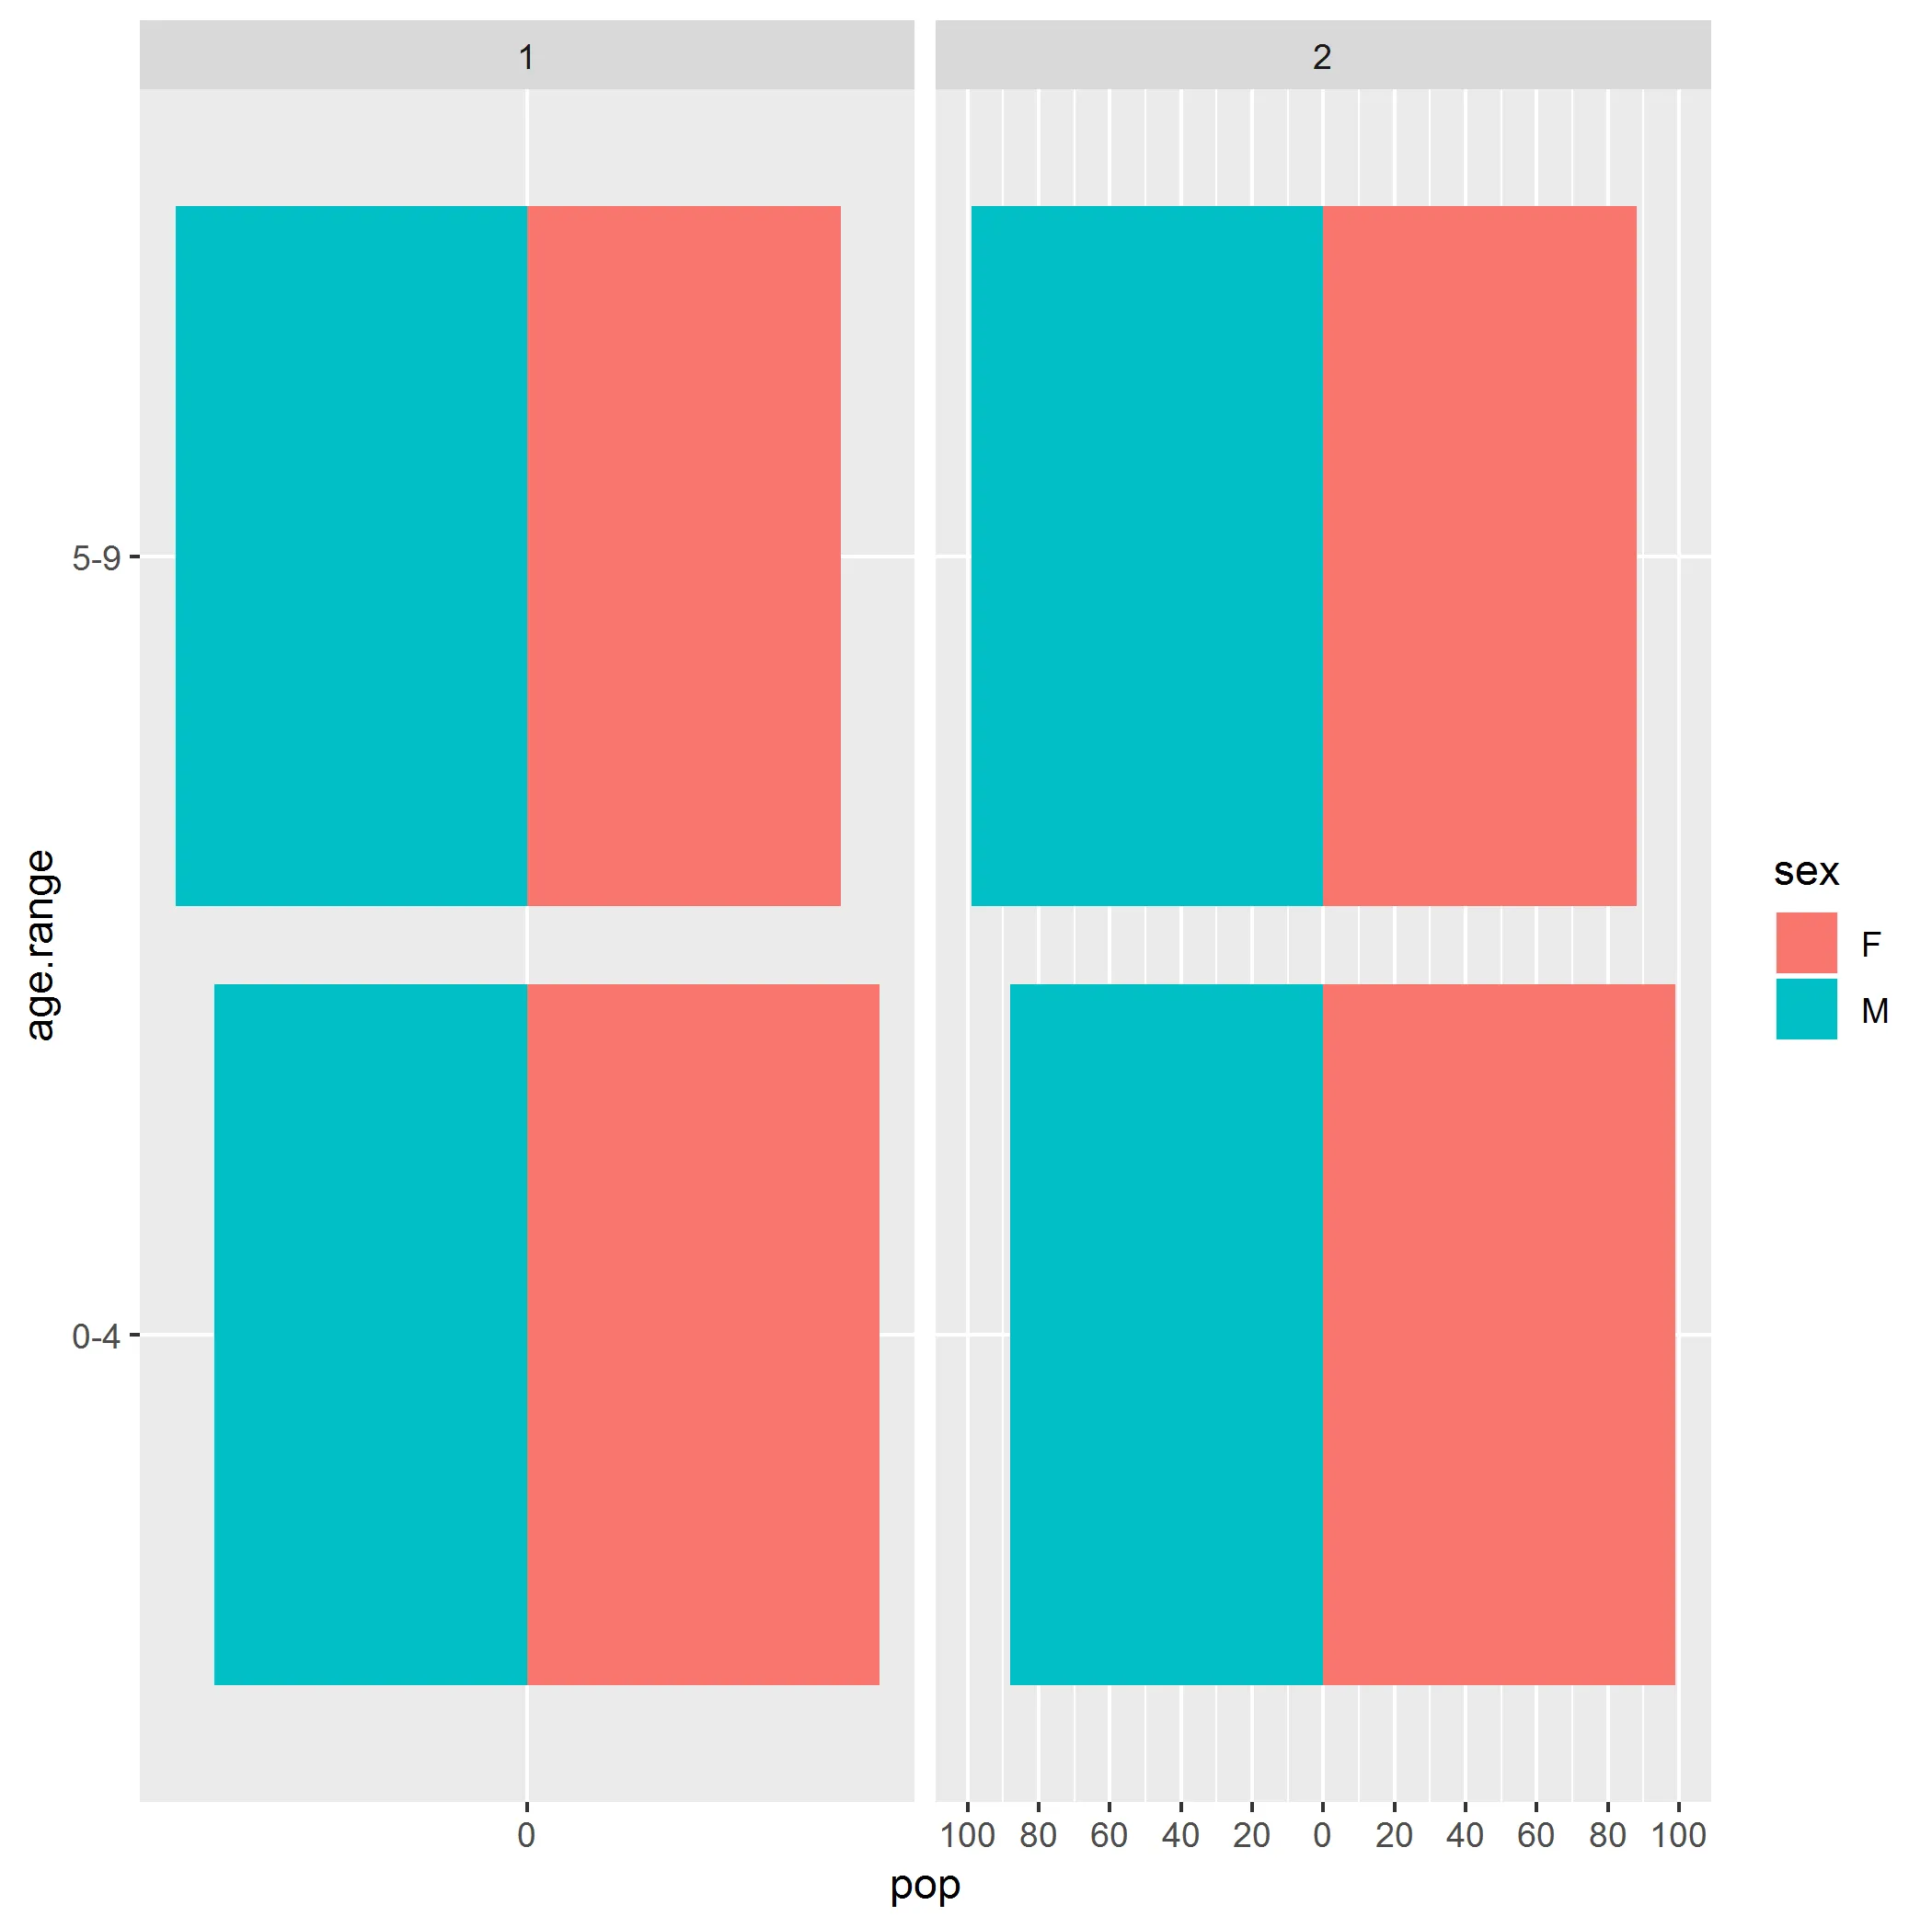
是否有一种方法可以设置scale_y_continuous(),以便我可以在不同的facet中具有不同的刻度,同时保持:scales = free_x。否则,是否有其他方法可以使用除scale_y_continuous()之外的其他方法消除金字塔中的负数。
如果不能,那么唯一的方法就是分别开发每个图像,然后使用ggarrange()或cowplot()手动分面?
编辑:
根据评论,我尝试使用facetscales(),但我无法让它按照我想要的方式工作,也无法完全理解man文件。
使用此处的指令:https://github.com/zeehio/facetscales,我安装并加载了该软件包。
library(facetscales)
然后我创建了刻度列表:
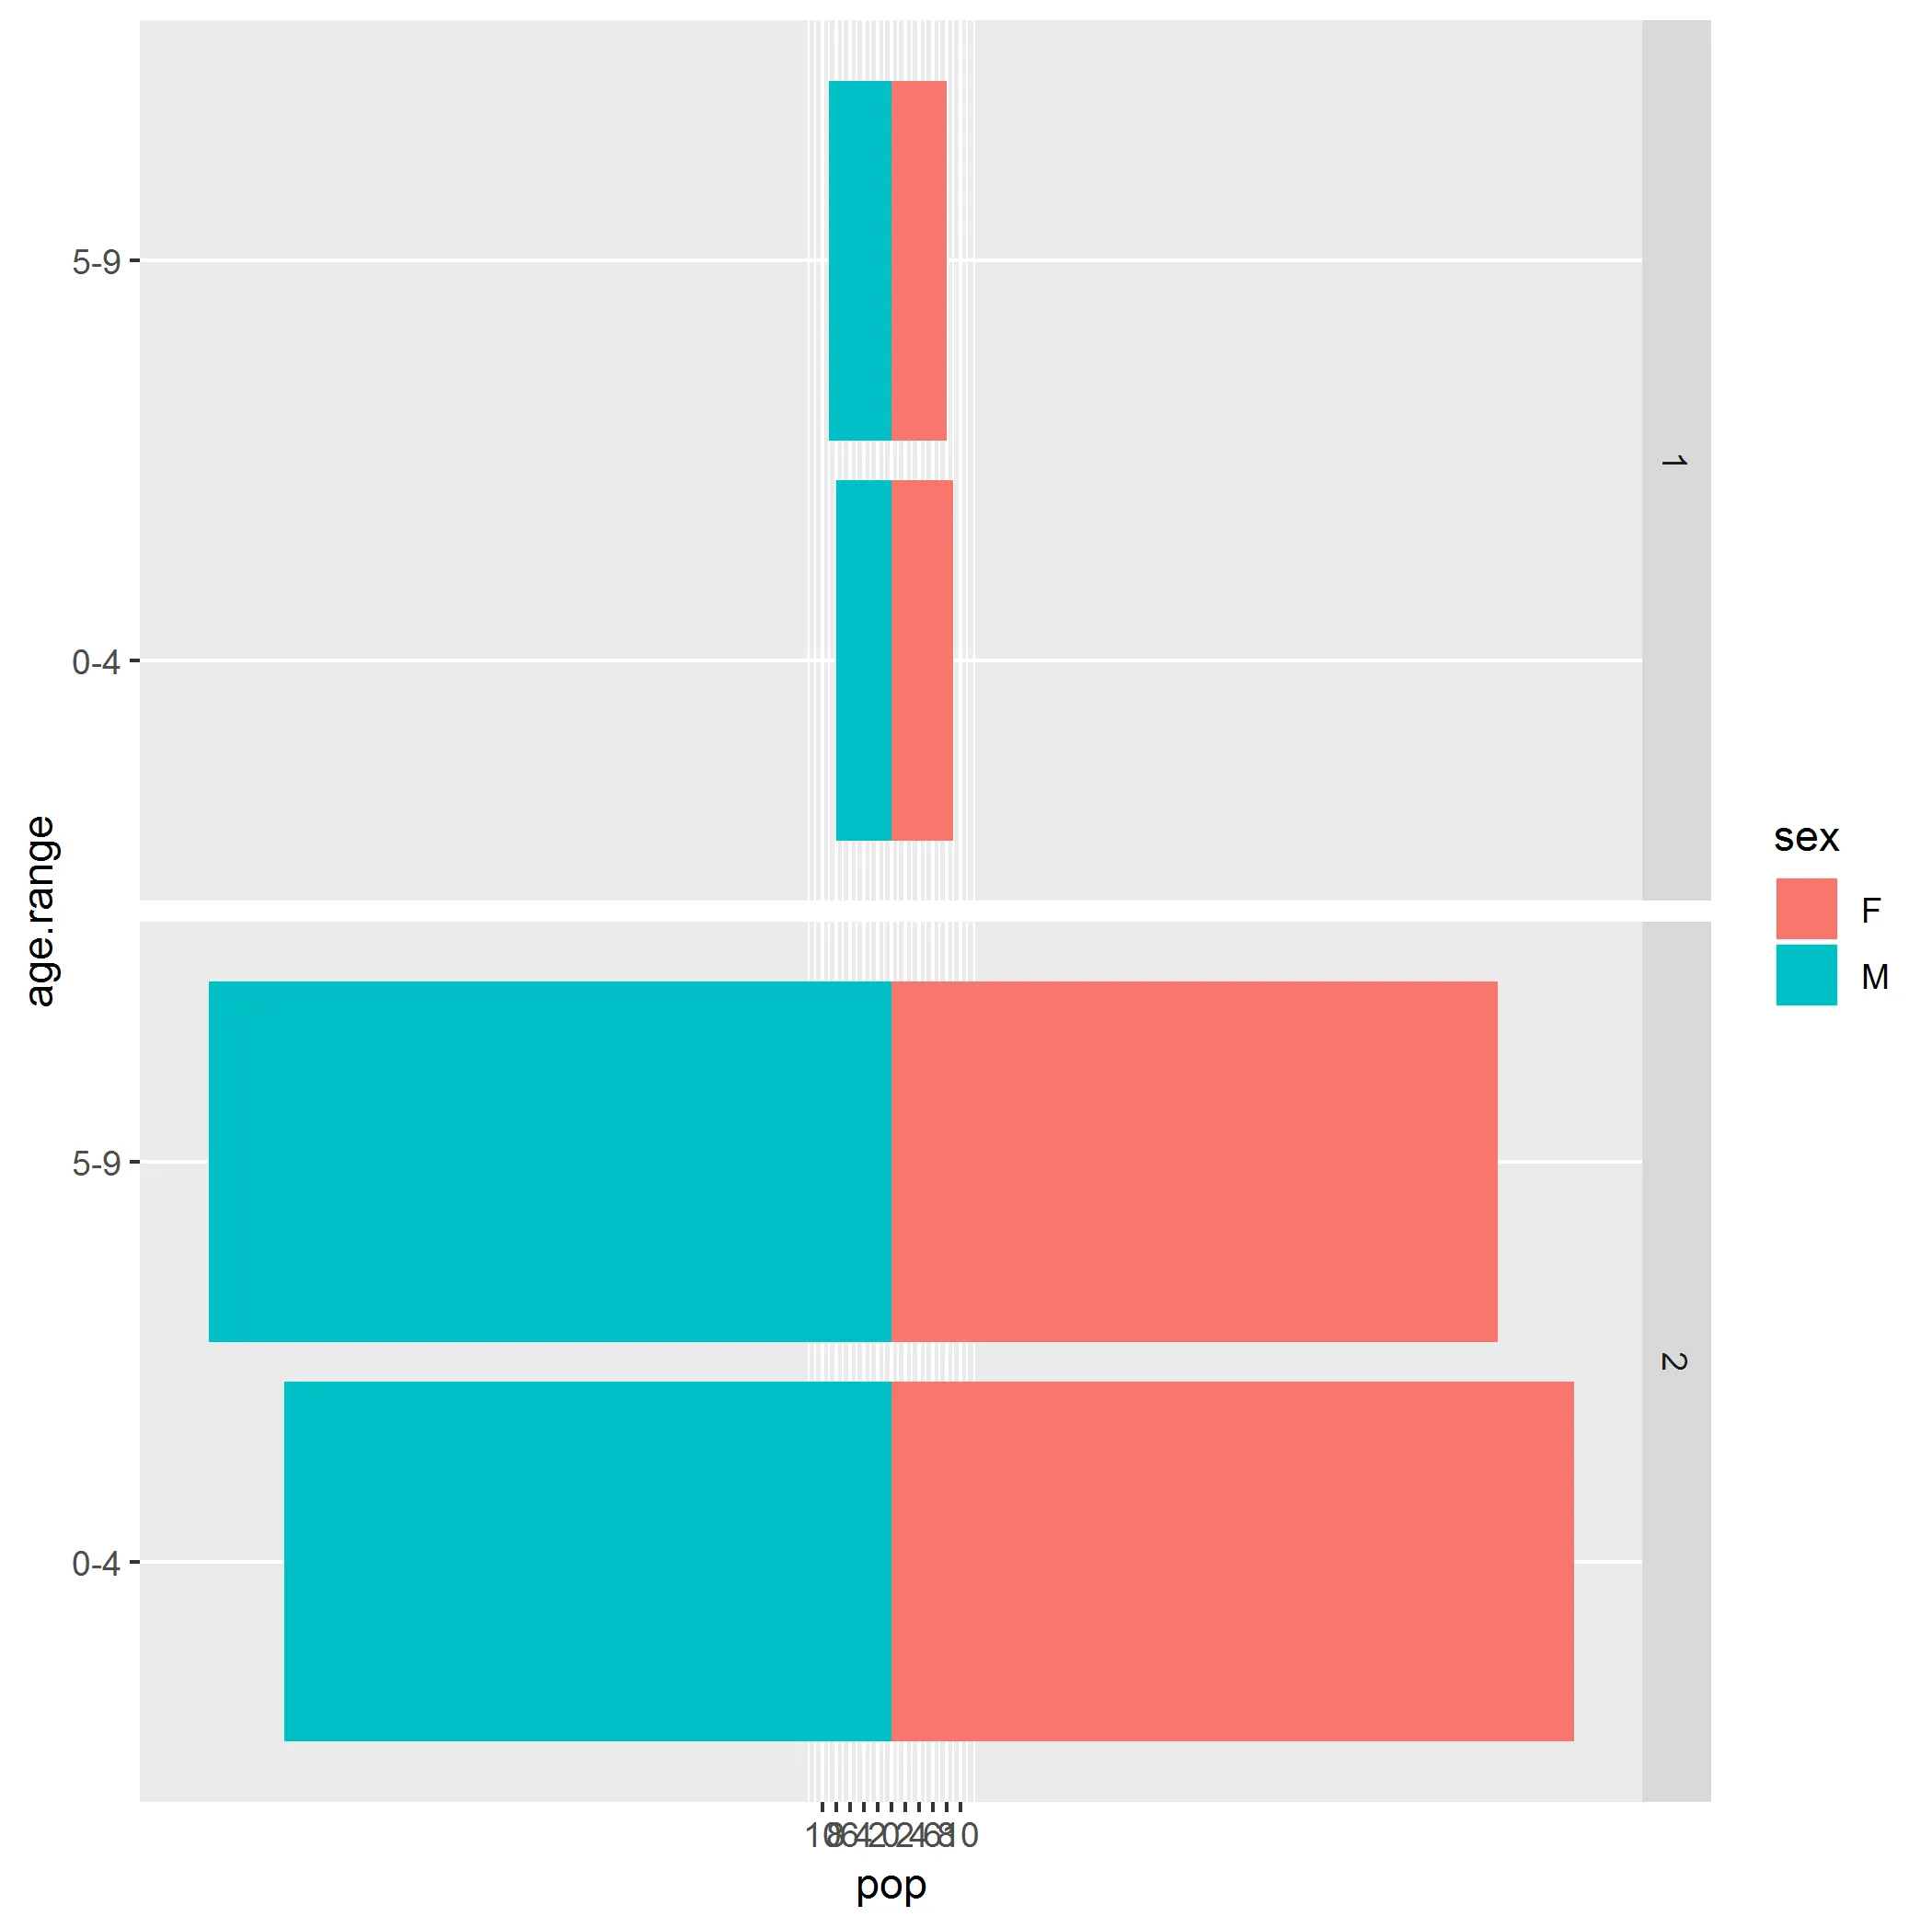
scales.pyr <- list(`1` = scale_y_continuous(breaks = seq(-10, 10, 2), labels = abs(seq(-10, 10, 2))), `2` = scale_y_continuous(breaks = seq(-100, 100, 20), labels = abs(seq(-100, 100, 20))))
更新 ggplot:
ggplot(pop.pyr, aes(x = age.range, y = pop, fill = sex)) +
  geom_col(data = subset(pop.pyr, sex == "M")) +
  geom_col(data = subset(pop.pyr, sex == "F")) +
  coord_flip() +
  facet_grid_sc(rows= vars(country), scales = list(y = scales.pyr))
如果我尝试使用cols:facet_grid_sc(rows = NULL, cols = NULL, scales = "fixed", space = "fixed", shrink = TRUE, labeller = "label_value", as.table = TRUE, switch = NULL, drop = TRUE, margins = FALSE, facets = NULL)
...
\item{cols}{一组由\code{\link[=vars]{vars()}}引用的变量或表达式,定义了行或列维度上的分面组。这些变量可以被命名(名称将传递给\code{labeller})。
ggplot(pop.pyr, aes(x = age.range, y = pop, fill = sex)) +
geom_col(data = subset(pop.pyr, sex == "M")) +
geom_col(data = subset(pop.pyr, sex == "F")) +
coord_flip() +
facet_grid_sc(cols= vars(country), scales = list(y = scales.pyr))
我得到:
Error in .subset2(x, i, exact = exact) :
  attempt to select less than one element in get1index
正如清楚所示,比例尺是固定的,而且man页面也说我可以使用
scales = "free"或过时的"free_x"。
\item{scales}{由两个元素(x和y)组成的列表。每个元素都可以是"fixed"(在不同facets之间共享比例尺限制)、"free"(每个facet有不同的限制) 或者一个命名列表,为每个facet值提供不同的比例尺。先前的比例尺值("fixed","free_x","free_y","free")被接受但已弃用。
但是代码示例要求用比例尺列表来填充scales参数。最后,我真的希望在两行三列中有六个区域。man页面表明我可以使用rows和cols来分面不同的变量,但是我没有看到任何关于单个变量的
nrow(),ncol()的引用。在更大的例子中使用它们会出现:unused argument (ncol = 3)。
facetscales包:https://github.com/zeehio/facetscales - markusscale_y_continuous(labels = abs)对你起作用了吗?这样的话,你不必明确指定中断点。 - Z.Lingeom_col层。您引用的链接是指向 这个解决方案,其中将转换为负数的操作在第二个 geom 层中完成。由于您的数据已经是负数,将其拆分成两个层没有额外的好处。 - Z.Linscale_y_continuous(labels = abs)解决了问题。另外,你是对的,不需要两个geom_col()调用。下面提供了解决方案。 - MorrisseyJ