我有一个像这样的数据框:
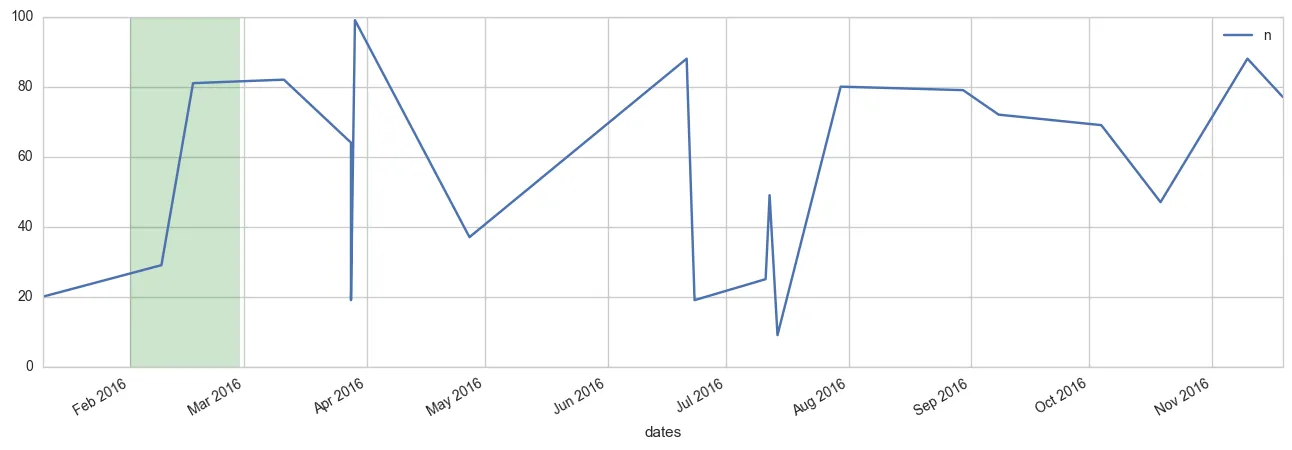
我想绘制一个图表,并在二月和三月之间使用axvspan。由于我的日期是随机的,我该如何选择这两个月并使用axvspan?
我的绘图代码很简单。
from datetime import date
import random

start_date = date.today().replace(day=1, month=1).toordinal()
end_date = date.today().toordinal()

df=pd.DataFrame.from_dict({'dates':[ date.fromordinal(random.randint(start_date, end_date)) for i in xrange(10) ]
                        ,'n':np.random.randint(0,100,10)})
df.index=df['dates']; del df['dates']
df.sort_index(inplace=True)
这会生成
             n
dates
2016-01-24   0
2016-02-26  98
2016-03-04  68
2016-03-26  45
2016-05-03  89
2016-05-09  83
2016-05-11  58
2016-07-29  53
2016-09-18  79
2016-10-20  57
我想绘制一个图表,并在二月和三月之间使用axvspan。由于我的日期是随机的,我该如何选择这两个月并使用axvspan?
我的绘图代码很简单。
ax=df.plot()