假设我有这个数据框:
    Type       Cat1       Cat2       Cat3
0   A      0.384000   0.393000   0.458000
1   B      0.603337   0.381470   0.299773
2   C      0.585797   0.452570   0.317607
3   D      0.324715   0.765212   0.717755
我这样绘制(从这里):
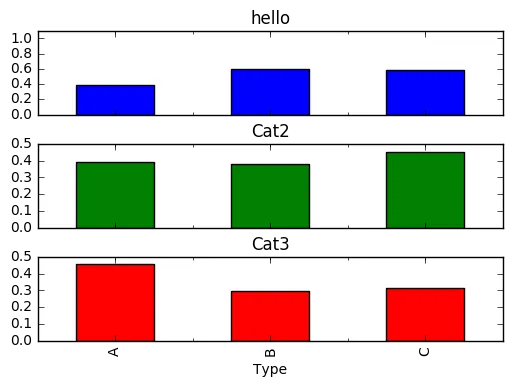
axes = df.set_index('Type').plot.bar(subplots=True, legend=False)
plt.subplots_adjust(hspace=0.35)
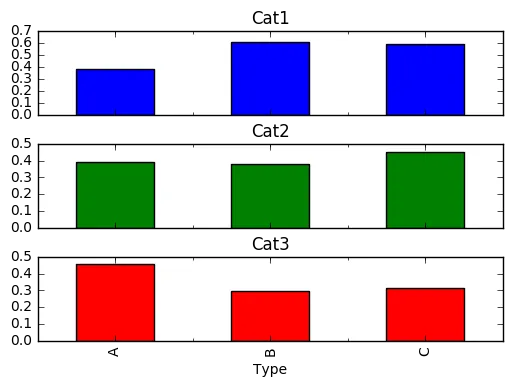
ylim?以及如何修改Cat标题的字体大小?